
Efficiency Ratio — What It Measures and How to Use It
An efficiency ratio shows how much revenue a company pulls from its assets, inventory, and receivables, and how to read the number without fooling yourself.
An efficiency ratio measures how much output a company squeezes from the resources it already controls. The most common forms compare sales to the assets, inventory, or receivables that produced them, so a higher turnover usually means leaner operations. Read on its own, the number says little. Read against the company's own history and its direct peers, it starts to show whether a business is tightening or quietly loosening.
Most beginners treat the efficiency ratio as a grade. A high number is good, a low number is bad, end of story. That framing fails the moment you compare a software firm to a grocery chain. The ratio is not a verdict. It is a question: given what this company owns, how hard is that capital working, and is the trend moving the right way?
What an efficiency ratio actually measures
Efficiency ratios sit in the activity group of financial-statement analysis. They link a flow item from the income statement, usually revenue or cost of goods sold, to a stock item from the balance sheet, usually assets, inventory, or receivables. The result tells you how many times per year a resource cycles through the business.
Think in terms of work done per dollar tied up. If a company holds 100 dollars of inventory and runs 500 dollars of cost of goods sold through it in a year, that inventory turned five times. Each turn is a chance to earn a margin. More turns from the same capital base is the practical meaning of efficiency here.
This matters because capital has a cost whether or not the business uses it well. Idle inventory still occupies a warehouse. Slow receivables still represent cash the company is owed but cannot spend. The efficiency ratio puts a number on how quickly those resources convert back into sales and, eventually, cash.
That framing also explains why efficiency ratios sit apart from the profitability and leverage groups. Profitability asks how much margin survives. Leverage asks how the asset base is funded. Efficiency asks a narrower, more operational question: how busy is the capital. A company can look profitable on a single quarter and still be drifting toward trouble if its assets are turning more slowly each year. The activity ratios are often the first place that drift becomes measurable.
The efficiency ratio formula and its main variants
There is no single efficiency ratio formula. There is a family of them, each isolating a different resource. The shared logic is a flow figure divided by the average balance that supported it.
For a balance-sheet input, use the average of the opening and closing values, not the year-end figure alone. A business that doubles inventory on the last day of the year would otherwise look far less efficient than it really was across the period.
The variants that carry the most weight in practice:
Asset turnover: revenue divided by average total assets. How much sales the entire asset base generates.
Inventory turnover: cost of goods sold divided by average inventory. How many times stock cycles in a year.
Receivables turnover: revenue divided by average accounts receivable. How quickly the company collects what it is owed.
Operating ratio: operating expenses plus cost of goods sold, divided by net sales. The share of every sales dollar consumed by running the business.
Banks use a separate version entirely. The bank efficiency ratio divides non-interest operating costs by the sum of net interest income and non-interest income. For most operating companies, asset turnover and inventory turnover do the heavy lifting.
A worked efficiency ratio calculation
Numbers make the formula concrete. Take a company with annual net sales of 500,000 dollars. It opened the year with 150,000 dollars in total assets and closed with 200,000 dollars.
First, average the asset base: (150,000 + 200,000) divided by 2 equals 175,000 dollars. Then divide sales by that average: 500,000 divided by 175,000 gives an asset turnover of roughly 2.9.
The interpretation is direct. For every dollar of assets on the books, the company produced about 2.9 dollars of sales over the year. Run the same arithmetic on inventory or receivables and you get the turnover for that specific resource. The mechanics never change: a flow figure on top, an average balance underneath.
How to interpret the result without fooling yourself
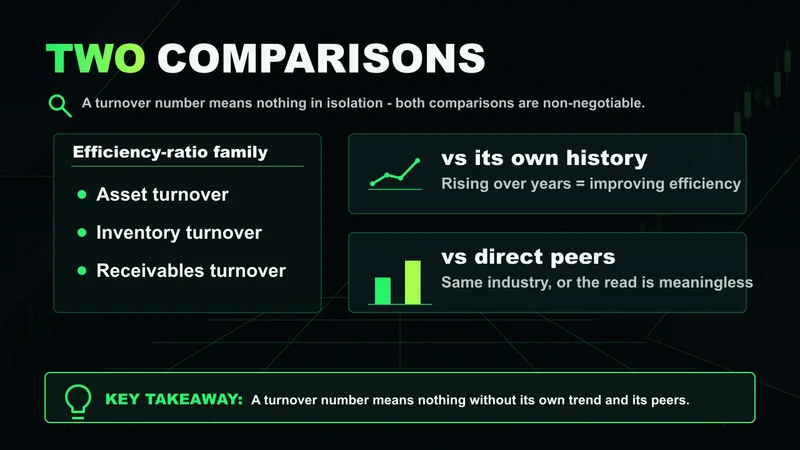
A turnover number means nothing in isolation. Interpretation lives in two comparisons, and both are non-negotiable.
The first is the company against itself over time. A rising asset turnover across several years suggests management is generating more sales from the same or a smaller capital base. A falling one suggests assets are accumulating faster than the revenue they support. The direction often tells you more than the level.
The second is the company against close peers in the same industry. A grocer and a consulting firm live in different worlds. Grocers carry thin margins and survive on high inventory turnover. Asset-light service businesses turn capital far faster because they hold almost no inventory at all. Comparing across those lines produces a number with no meaning.
There is a real edge in reading the trend rather than the snapshot. Markets reward businesses that quietly improve how hard their capital works, and they punish the ones whose efficiency erodes while reported earnings still look fine. The ratio often shifts before the income statement admits anything is wrong.
The market does not care about opinions, effort, or conviction. The trend in how a business uses its capital is visible in the numbers whether or not anyone is paying attention.
— MRPNL
This is also why the level alone is a weak signal. Two companies can post the same asset turnover while one is climbing out of a slow patch and the other is sliding into one. Only the multi-year path tells those two apart, and the path is what an experienced reader watches first.
What separates an efficiency ratio from a profitability ratio
Beginners frequently blur efficiency ratios and profitability ratios because both gauge performance. They answer different questions.
Efficiency ratios measure how hard the company works its resources to generate sales. Profitability ratios measure how much profit survives from those sales. A business can be highly efficient and barely profitable if its margins are crushed by competition. Another can be modestly efficient yet very profitable on the strength of pricing power.
The two are most useful read together. High asset turnover paired with a slim profit margin describes a high-volume, low-margin operation, a discount retailer being the classic case. Low turnover paired with a fat margin describes the opposite, a business that holds more capital but earns far more on each sale. Neither pattern is inherently better. The pairing simply tells you what kind of business you are looking at.
How investors actually use efficiency ratios when screening
Most write-ups stop at the definition. The more useful question is how an efficiency ratio fits into a real screening workflow, because that is where it earns its keep.
In practice, efficiency ratios are a filter, not a final answer. An investor screening a sector ranks companies on asset and inventory turnover, then looks for the outliers in both directions. A turnover well above the peer group can mean genuine operational discipline, or it can mean the company is running too lean and starving itself of inventory it needs. A turnover well below the group can flag bloat, or it can flag a business investing ahead of a growth phase. The ratio surfaces the names worth a closer look; it does not close the case.
The sequence that holds up: start with the trend in the company's own ratios, confirm against the industry median, then dig into why any gap exists. The number is the entry point to the question, never the conclusion. Process over outcome applies to analysis as much as it does to execution.
The same discipline keeps a screen honest. A ranking will always produce a top and a bottom, and the temptation is to act on the extremes without asking what produced them. A retailer at the top of an inventory-turnover screen might be running a genuinely tight operation, or it might be chronically understocked and losing sales it never records. The ratio cannot tell those apart on its own. It only earns its place in the workflow when it sends you to the filings to find out which story is true.
The limitations that quietly distort the number
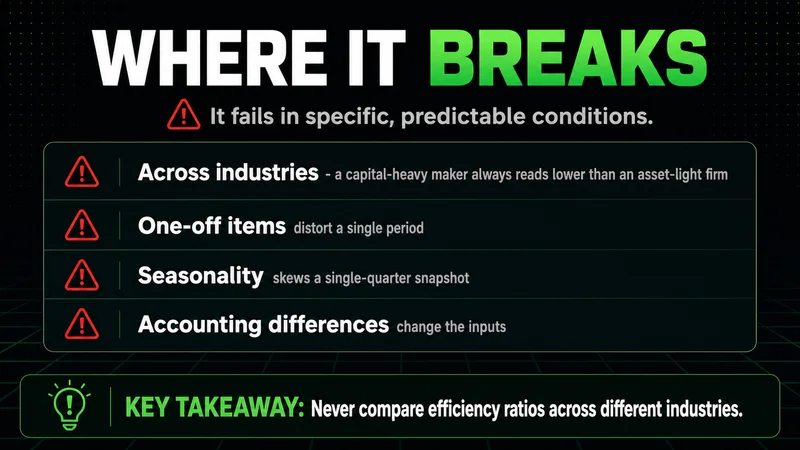
The efficiency ratio breaks down in specific, predictable conditions, and knowing them is what separates a useful read from a misleading one.
It fails hardest across industries. A capital-intensive manufacturer will always show lower asset turnover than an asset-light software firm, and that gap reflects business models, not management skill. Compare only within a sector.
It also distorts during heavy investment. A company building a new plant loads its balance sheet with assets that have not yet produced revenue, so asset turnover sinks temporarily even when the long-term decision is sound. The same applies to a seasonal business measured at the wrong point in its cycle, where year-end inventory bears no resemblance to the working average.
And it leans entirely on accounting figures. Different depreciation methods, inventory accounting choices, and one-time write-downs all move the inputs without any change in real operations. The ratio reads cleanly for a stable business compared against its own past and its direct peers. Pull it out of that context and the number can point exactly the wrong way.
Common efficiency ratio mistakes beginners make
A short list of the errors that recur most often, because avoiding them costs nothing and prevents most bad reads:
Comparing companies across different industries and treating the gap as a quality signal.
Using the year-end balance instead of the average of opening and closing balances.
Reading a single year in isolation rather than the multi-year trend.
Confusing efficiency with profitability and assuming a high turnover means a good investment.
Ignoring one-time events, such as an acquisition or write-down, that temporarily warp the inputs.
None of these require advanced skill to avoid. They require slowing down long enough to ask what the number is actually comparing.
FAQs
What is the efficiency ratio in simple terms? It is a measure of how much revenue a company generates from a given resource, such as its assets, inventory, or receivables. A higher turnover generally means the company is using that resource more intensively.
What is a good efficiency ratio? There is no universal target. A good ratio is one that holds steady or improves against the company's own history and sits at or above the median for its specific industry. The right benchmark is always the peer group, never an absolute number.
How do you calculate the efficiency ratio? Divide a flow figure from the income statement, usually revenue or cost of goods sold, by the average of the opening and closing balance of the resource it relates to. Average the balance rather than using the year-end figure so a late swing does not distort the result.
What is the difference between an efficiency ratio and a profitability ratio? An efficiency ratio measures how hard a company works its resources to produce sales. A profitability ratio measures how much profit remains from those sales. Read together, they describe whether a business is high-volume and low-margin or the reverse.
Why can't I compare efficiency ratios across industries? Different industries carry fundamentally different asset and inventory structures. An asset-light service firm will always turn capital faster than a capital-intensive manufacturer, so a cross-industry gap reflects the business model rather than management performance.
Related reading on financial-statement analysis
Efficiency ratios are one lens in a wider toolkit. To build a fuller picture of how a company converts capital into results, pair them with profitability ratios, which measure the margin that survives each sale, and leverage ratios, which show how much of the asset base is funded by debt. Read alongside the income statement and the cash-flow statement, the turnover figures stop being a single grade and become part of a connected view of how the business actually runs.
Worth the read?


