
Financial Ratio Analysis — Reading the Numbers Right
Financial ratio analysis turns raw statements into comparable numbers. Learn the formulas, how to interpret them, and where ratios mislead.

Financial ratio analysis is the practice of dividing one line from a company's financial statements by another to turn raw dollars into a comparable number. A current ratio, a profit margin, a debt-to-equity figure: each one compresses a balance sheet or income statement into something you can stack against last year, against a competitor, or against the price you are being asked to pay. That is the whole point. Ratios do not tell you what a company earned. They tell you whether what it earned is good, given everything else.
The trap is treating the ratio as the answer. A ratio is a question with the units stripped out. It tells you where to look next, not what to conclude. Most people who run the numbers stop at the calculation and skip the part that actually matters, which is reading the number against a context that explains why it landed where it did.
What financial ratio analysis actually means
The meaning of financial ratio analysis is narrower than people assume. It is not a verdict on a business. It is a measurement technique. You take two figures that already exist in the financial statements, form a relationship between them, and compare that relationship to a reference point. Without the reference point, the number is inert. A net margin of 8 percent means nothing on its own. Against a sector that runs at 3 percent, it is a strength. Against a sector that runs at 20 percent, the same 8 percent is a warning.
Ratios fall into a few working groups, and most analysis lives inside these:
- Liquidity ratios measure whether a company can cover its short-term obligations. The current ratio and quick ratio sit here.
- Leverage and solvency ratios measure how much of the business is financed by debt. Debt-to-equity and the interest coverage ratio belong in this group.
- Profitability ratios measure how efficiently revenue converts into earnings. Gross margin, net margin, return on equity, and return on assets are the common ones.
- Efficiency ratios measure how hard the company works its assets. Inventory turnover and asset turnover are the standard examples.
- Market value ratios measure how the market is pricing the business. The price-to-earnings ratio is the one almost everyone has seen.
Each group answers a different question. Liquidity asks whether the company survives the next quarter. Solvency asks whether it survives the next cycle. Profitability and efficiency ask whether it is worth owning at all. You rarely need every ratio. You need the two or three that speak to the decision in front of you.
The core formulas, and why the formula is the easy part
The financial ratio analysis formula is almost never the hard part. The formulas are short, and they do not change:
- Current ratio = current assets divided by current liabilities.
- Quick ratio = (current assets minus inventory) divided by current liabilities.
- Debt-to-equity = total liabilities divided by shareholders' equity.
- Gross margin = gross profit divided by revenue.
- Net margin = net income divided by revenue.
- Return on equity = net income divided by shareholders' equity.
- Inventory turnover = cost of goods sold divided by average inventory.
- Price-to-earnings = share price divided by earnings per share.
You can memorize the whole set in an afternoon. The difficulty is never the arithmetic. It is knowing which figure to pull when the statements give you three versions of "income" and two versions of "equity," and knowing what each input quietly assumes. Net income, for instance, includes one-time items that may never repeat. Plug a one-time gain into a return-on-equity calculation and the ratio reports a strength the business does not actually have.
How to calculate financial ratio analysis step by step
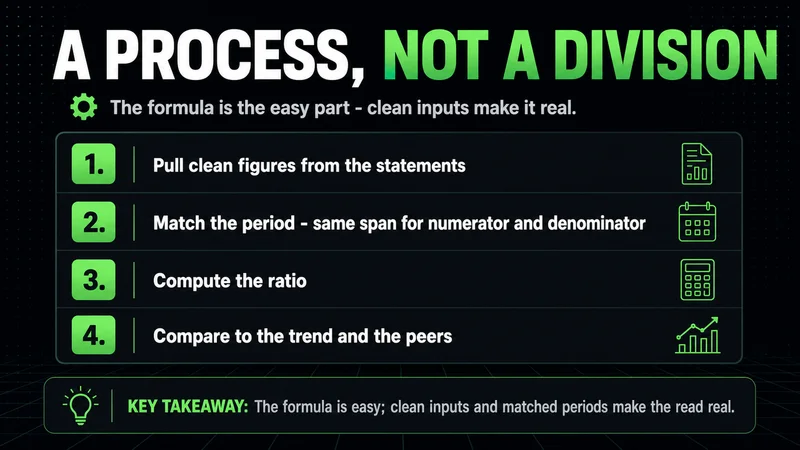
Calculation is a process, not a single division. Treating it as a process is what separates analysis from button-pushing.
- Pull clean figures from the statements. Use the same period for the numerator and denominator. Mixing a full-year income figure with a single quarter's balance sheet produces a number that means nothing.
- Normalize for one-time items. Strip out gains, write-downs, or charges that will not recur. The ratio should describe the ongoing business, not an accounting event.
- Compute the ratio. Apply the formula.
- Anchor it to a reference. Compare to the company's own history, to direct competitors, and to the sector. A ratio without a reference is a number without a meaning.
- Ask what changed. If the ratio moved, find the line item that moved it. The driver matters more than the ratio.
Step five is where most analysis stops too early. A current ratio that climbs from 1.2 to 2.0 looks like improving health. If the cause is inventory piling up because the product stopped selling, the ratio improved while the business deteriorated. The number went the right way for the wrong reason.
A worked financial ratio analysis example
Consider a simple financial ratio analysis example. A company reports current assets of 600 and current liabilities of 300, so the current ratio is 2.0. On paper, that is comfortable. It can cover short-term obligations twice over.
Now read it as an investor rather than an accountant. Of that 600 in current assets, suppose 400 is inventory that has not turned in two quarters. The quick ratio, which removes inventory, drops to roughly 0.67. The same company that looked safe under one ratio looks fragile under another. Neither number lied. They measured different things, and only reading both together told the real story.
This is the discipline that ratio analysis demands and that most write-ups skip. One ratio is a data point. The relationship between several ratios is the analysis. The current ratio and the quick ratio disagreeing is not a contradiction to resolve; it is the signal itself.
How investors should interpret the numbers
Interpretation is the entire job. The financial ratio analysis interpretation step is where a number becomes a decision, and it rests on context the formula cannot supply.
Three contexts matter, and a ratio read without all three is barely read at all:
- Trend — where the ratio sits today against where it sat over the past several years. A single profitability reading tells you little; a margin compressing for six straight quarters tells you a great deal.
- Peers — the same ratio for the closest competitors, because what counts as healthy is entirely industry-specific.
- Driver — which line item is moving the ratio, and whether that movement is durable or temporary.
A high return on equity is the classic example of a number that demands interpretation. It can mean a genuinely efficient business. It can also mean a company that has bought back so much stock with borrowed money that the shrinking equity base flatters the ratio while the debt load quietly grows. The ratio reads as strength. The mechanism behind it is risk. Without decomposing the driver, you cannot tell the two apart, and they point to opposite decisions.
The number that looks best is the one most worth questioning. A ratio that flatters the business is usually the first place to check for an explanation you would rather not find.
The professional habit here mirrors the discipline of reacting to evidence rather than predicting from a clean number. A ratio is evidence. It is not a forecast, and it is not a guarantee of how the next quarter prints.
How to use benchmarks without being misled by them
A financial ratio analysis benchmark is only useful when the comparison is fair. The most common interpretation error is comparing a company to the wrong reference. A software company and a grocery chain run completely different balance sheets; their current ratios are not measuring the same kind of health. A debt-to-equity figure that signals distress for one industry is routine for another that runs on stable, asset-backed cash flow.
When you benchmark, hold three things constant:
- Industry. Compare within the sector, never across sectors.
- Size and stage. A mature company and a high-growth one carry debt and convert revenue to profit on different terms.
- Accounting method. Two companies using different inventory or depreciation conventions can post different ratios from identical operations.
Benchmarks are anchors, not answers. They tell you whether a number is unusual. They do not tell you whether unusual is good. That last step always returns to the specific business.
Financial ratio analysis vs financial statement analysis
These two terms get used interchangeably, and they should not be. Financial statement analysis is the whole examination of a company's financial statements: reading the footnotes, tracking how revenue is recognized, following cash through the cash flow statement, and judging the quality of reported earnings. Financial ratio analysis is one tool inside that larger examination.
The distinction matters because ratios can be clean while the statements behind them are not. Statement analysis covers ground that ratios never reach:
- Footnotes — the disclosures that explain how the headline numbers were built, including revenue recognition and off-balance-sheet items.
- Earnings quality — whether reported profit is backed by cash or by accounting estimates that may reverse.
- Cash flow — how money actually moved through the business, which a profit figure can hide.
A company can post a healthy current ratio and a strong margin while its footnotes disclose aggressive revenue recognition that inflates both. The ratios summarize the numbers. They do not audit them. Statement analysis is the work of deciding whether the numbers deserve to be trusted before you ever turn them into a ratio. Run ratios on figures you have not scrutinized, and you have measured a story rather than a business.
The limitations every analyst has to respect
The limitations of financial ratio analysis are not edge cases. They are structural, and they define where the tool stops working.
- Ratios are backward-looking. They describe a period that already closed. They are not a prediction of the next one.
- Accounting choices distort comparability. Different depreciation, inventory, and revenue methods make two companies look different when their operations are the same.
- One-time items mislead. A single asset sale can inflate profitability for a period and make the next period look like a collapse by comparison.
- Ratios ignore everything off the statements. Management quality, competitive position, and pending litigation never appear in a ratio, yet any of them can matter more than the entire numerical picture.
This is the point where the method breaks down most reliably: ratios stop being meaningful precisely when the business is changing fastest. A company in the middle of an acquisition, a restructuring, or a sharp shift in its market produces statements that compare poorly to its own past and to its peers. The ratios still calculate cleanly. They just no longer describe a stable business, and reading them as if they do is how confident analysis becomes wrong analysis. In a steady, mature company the ratios carry real weight; through a transition they often carry almost none.
Reading ratios as part of a process, not a verdict
Financial ratio analysis works best as the entry point to a question, not the closing argument. The numbers tell you where to look. They flag the liquidity that tightened, the margin that slipped, the leverage that crept up. Then the actual work begins: finding out why, and deciding whether the cause is temporary or structural.
The analysts who get the most out of ratios treat them the way a disciplined trader treats a setup. The number is a reason to investigate, not a reason to act. A single strong reading does not earn conviction, and a single weak one does not justify a verdict. What earns conviction is the combination:
- Several ratios pointing the same direction rather than one in isolation.
- A trend that holds across multiple periods rather than a single reading.
- A driver you can name and judge as durable or temporary. Run the numbers, anchor them to a fair reference, find what moved them, and treat the cleanest-looking ratio with the most suspicion. That is the full discipline, and it is most of the edge.
FAQs
What is financial ratio analysis in simple terms? It is the practice of dividing one figure from a company's financial statements by another to create a comparable number, then reading that number against history, competitors, or the price being asked. The ratio turns raw dollars into something you can judge.
What is a good financial ratio? There is no universal answer, because a healthy ratio is entirely industry-specific. A debt-to-equity figure that signals stress in one sector is routine in another. A ratio is good or bad only relative to a fair benchmark: the company's own history and its direct peers.
How is financial ratio analysis different from financial statement analysis? Statement analysis is the full examination of the financial statements, including footnotes, earnings quality, and cash flow. Ratio analysis is one tool inside that larger process. Ratios can look clean even when the statements behind them deserve scrutiny.
What is the most common mistake beginners make? Stopping at the calculation. The arithmetic is the easy part; the value is in anchoring the ratio to a fair reference and identifying which line item moved it. A number without a reference and a driver is a number without a meaning.
Worth the read?


