
Resistance Breakout — How to Confirm It Before You Enter
A resistance breakout is when price closes above a level that has rejected it. Learn how to confirm acceptance before you enter a trade.

Resistance Breakout — How to Confirm It Before You Enter
A resistance breakout is the moment price closes above a level that has repeatedly rejected it, signaling that buyers have taken control of an area where sellers used to win. That is the textbook definition, and it is also where most traders make their first mistake. The breakout candle is not the signal. What price does after it clears the level is the signal. The level breaking tells you sellers stepped aside for a moment. Acceptance above it tells you they are not coming back yet.
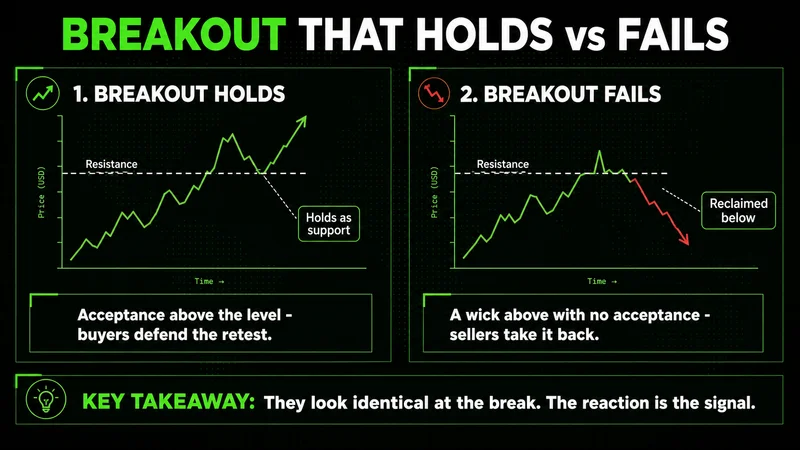
That distinction is the whole game. A resistance breakout that holds and a resistance breakout that fails look identical for the first few seconds. The difference shows up in the reaction, not the break.
What a resistance breakout actually means
Resistance is a price area where supply has historically overwhelmed demand. Price approaches, sellers defend, and the move stalls. When that happens two or three times at roughly the same level, the level becomes visible to everyone watching the chart. That shared attention is what gives it meaning.
The resistance breakout meaning is simple once you frame it structurally. A breakout is a shift in who controls the level. Below resistance, sellers are in charge. A clean break with acceptance above suggests demand has absorbed the supply that used to cap the move, and the prior ceiling can become a floor.
Volume usually rises into a real break because more participants are willing to transact at the new price. That is not a rule you trade mechanically, but it is context. A break on thin volume is a question, not an answer.
Why most resistance breakouts fail
Most breakouts fail because traders enter emotionally instead of structurally. The level cracks, the candle expands, and the urge to chase arrives before any confirmation does. That urgency is the tell. When a setup feels like it is leaving without you, you are usually reacting to the move rather than reading it.
A failed resistance breakout has a specific structure. Price pokes above the level, fails to find continuation buyers, and gets reclaimed below the level on the next few candles. The traders who entered on the break are now offside, and their stops become fuel for the move back down. This is why false breaks often reverse harder than clean ones. The liquidity that triggered the entries becomes the liquidity that powers the reversal.
A break tells you the level moved. Acceptance tells you it mattered. Trade the second thing, not the first.
The structural read protects you from the emotional one. If you require acceptance above the level before committing risk, you sit out most of the fakeouts by definition. You will miss a handful of breakouts that run without looking back. That is an acceptable cost. Protecting capital through the false breaks matters more than catching every clean one.
How to confirm a resistance breakout before you enter
Resistance breakout confirmation is about waiting for evidence that the new price is being accepted, not just touched. There is no single confirmation that works in every condition, so most experienced traders stack a small number of simple ones rather than overloading the chart.
How to confirm a resistance breakout before entering a trade comes down to a few questions:
- Did price close above the level on the timeframe you trade, or did it only wick above intrabar?
- Is the candle a decisive body, or a long upper wick that already shows rejection?
- Did volume or participation expand on the break, or did the move happen quietly?
- On a pullback, does the former resistance now hold as support?
The retest is the cleanest confirmation available. After a break, price often pulls back toward the former resistance. If that level now holds as support and price turns back up, the breakout has demonstrated acceptance. You also get a risk-defined entry: your invalidation sits just below the reclaimed level, so a failure costs you a small, predefined loss instead of an emotional one.
You do not need every box checked. You need enough that the trade has a defined invalidation and a reason to exist beyond the candle being green.
Resistance breakout vs support breakout
A resistance breakout and a support breakout are the same mechanic pointed in opposite directions. Understanding resistance breakout vs support breakout keeps you from misreading which side liquidity sits on.
| Element | Resistance breakout | Support breakout |
|---|---|---|
| Level being broken | Prior ceiling (supply) | Prior floor (demand) |
| Direction of the break | Upward | Downward |
| What it suggests | Buyers absorbed supply | Sellers absorbed demand |
| Former level becomes | Support on a retest | Resistance on a retest |
| Common trap | Chasing the break with no acceptance | Shorting into a spring or stop run |
The logic is symmetrical, but the psychology is not. Support breaks tend to move faster because fear acts quicker than greed. That speed is exactly why a support break can flush stops and reverse before the move is real. The same acceptance requirement applies on both sides.
A simple resistance breakout trading strategy
A workable resistance breakout trading strategy does not need many moving parts. Clear structure, defined risk, and disciplined management outperform complicated systems for most traders. Here is a process built around acceptance rather than the candle.
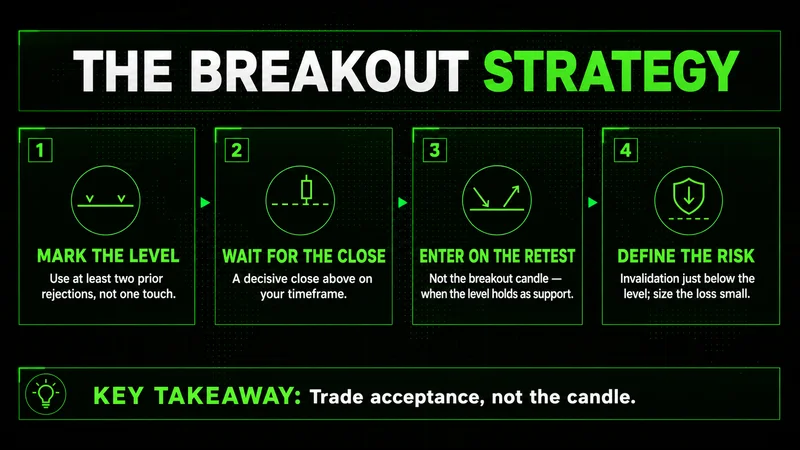
- Mark the resistance level using at least two prior rejections, not a single touch.
- Wait for a decisive close above the level on your trading timeframe.
- Do not enter on the breakout candle. Wait for the pullback toward the former level.
- Enter when the former resistance holds as support and price turns back up.
- Place your invalidation just below the reclaimed level and size the position so a stop-out is a small, controlled loss.
- Manage toward the next structural level, not toward a feeling.
A resistance breakout chart example makes this concrete. Imagine a stock that rejects three times near the same price over two weeks, then closes firmly above it. Instead of buying the breakout bar, you wait. Price drifts back to the old level, holds, and turns. That hold is your entry, and the level you just watched defend itself is your risk anchor.
The best timeframe for resistance breakout analysis
The best timeframe for resistance breakout analysis is the one that matches how long you intend to hold and how much noise you can tolerate. Higher timeframes produce fewer breakouts, but the levels carry more weight because more participants respect them. Lower timeframes give you more setups and more fakeouts.
A common approach is to define the level on a higher timeframe and refine the entry on a lower one. The daily chart tells you where the meaningful resistance breakout timeframe lives; the hourly or fifteen-minute chart tells you when acceptance is happening.
Here is where the framework breaks down, and it matters. A resistance breakout reads cleanly during regular cash-session hours, when volume is real and the level is being defended by genuine participation. The same break overnight, on thin liquidity, means almost nothing. A handful of contracts can push price through a level when no one is there to defend it, and the move evaporates when real volume returns. No strategy works in all market conditions. If you trade breakouts, respect the session you are trading in, because the same chart pattern carries different odds depending on when it prints.
Common resistance breakout mistakes beginners make
The common resistance breakout mistakes beginners make are almost never analytical. They are behavioral. The chart was usually readable; the discipline was not.
- Entering on the breakout candle instead of waiting for acceptance.
- Treating a single wick above the level as a confirmed break.
- Ignoring the broader context and trading a break against the higher-timeframe trend.
- Moving the stop wider after entry because the trade went against them.
- Sizing the position so large that one false break damages decision-making for the rest of the session.
That last point is the quiet account-killer. If a single losing breakout trade emotionally affects how you trade the next one, the position was too large. The mistake was not the entry. It was the size.
A resistance breakout checklist before risking capital
Run this resistance breakout checklist for new traders before committing risk. If you cannot answer the first four with a clear yes, the trade does not exist yet.
- Has the level rejected price at least twice before?
- Did price close above the level, not just wick through it?
- Is the break aligned with the higher-timeframe context?
- Has price retested the level and held it as support?
- Is my invalidation defined and placed below the reclaimed level?
- Is my position sized so a stop-out is a small, planned loss?
A checklist is not there to find more trades. It is there to remove the ones that only looked good for a moment. The waiting it forces is part of the job, not a flaw in the method.
FAQs
What is a resistance breakout in trading? It is when price closes above a level that has repeatedly rejected it, suggesting buyers have taken control of an area where sellers used to win. The break itself is only the start; acceptance above the level is what confirms it.
How do you confirm a resistance breakout before entering a trade? Wait for a decisive close above the level rather than an intrabar wick, look for expanding participation, and ideally wait for a pullback where the former resistance holds as support. That retest gives you both confirmation and a risk-defined entry.
What is the difference between a resistance breakout and a support breakout? They are the same mechanic in opposite directions. A resistance breakout clears a prior ceiling and turns it into potential support; a support breakout breaks a prior floor and turns it into potential resistance. Support breaks often move faster because fear acts quicker than greed.
What is the best timeframe for resistance breakout analysis? The one that matches your holding period. Many traders define the level on a higher timeframe like the daily and refine the entry on a lower one. Higher timeframes produce fewer but more reliable levels.
Why do so many resistance breakouts fail? Most fail because traders enter emotionally on the breakout candle instead of waiting for structural acceptance. Price pokes above the level, finds no continuation buyers, and gets reclaimed, trapping the traders who chased the break.
What is a good resistance breakout checklist for new traders? Confirm the level has rejected price at least twice, that price closed above it rather than wicking through, that the break aligns with higher-timeframe context, and that you have a defined invalidation below the reclaimed level with a position size that keeps a loss small.
Worth the read?


