Trading Journal and Performance Metrics, Explained
A working guide to the trading journal and the five performance metrics that turn per-trade rows into a usable read on your edge: win rate, expectancy.
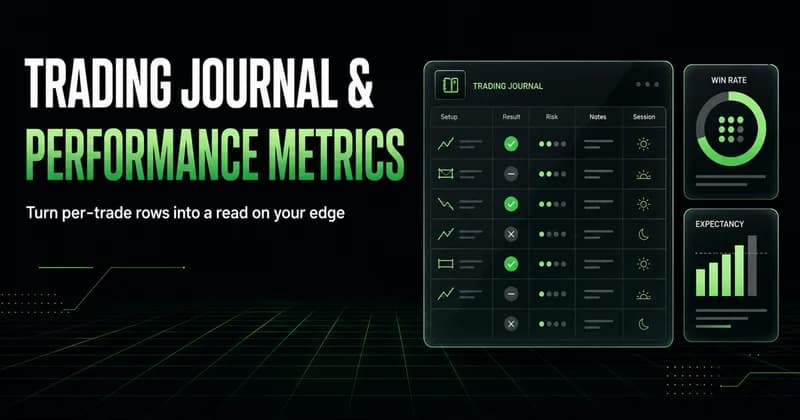
A trading journal is a structured record of every trade you take and the conditions around it; performance metrics are the numbers that record produces. Together they answer one question a P&L screenshot cannot: is the process actually working, or are recent results hiding what the next drawdown will expose. Most blown accounts look fine in the weekly screenshot. The journal is what catches them earlier.
What a trading journal actually is
A trading journal is a structured log of every position you take, recorded with enough context that you can rebuild the decision later without your memory filling the gaps. It is not a diary, and it is not a screenshot folder. The minimum is a row per trade with entry price, exit price, size, instrument, setup, and a short note on why you took it.
The point is not to look at trades. The point is to make them measurable. Once you have thirty or fifty rows, performance metrics start to mean something. Win rate stabilizes, expectancy becomes a real estimate instead of a recent-results illusion, and drawdown stops being a feeling and becomes a number.
Process drift — taking trades slightly outside the rules, sizing up after a green day, holding losers a little longer than the plan said — leaves a trail in the data before it leaves a hole in the equity curve.
What to record on every trade
If you only record the fill, you have a brokerage statement, not a journal. The fields that produce useful metrics later are the ones describing the conditions and the decision, not just the prices.
A working minimum per row:
Instrument — NQ, ES, GC, ticker. Performance by instrument matters more than most traders track.
Setup or playbook tag — which rule did this trade come from. Without this, win rate is an aggregate that hides which setup is actually carrying the account.
Entry price and exit price — both fills, including any partials. Average them honestly.
Position size — contracts or shares, and the dollar risk implied at the stop.
Planned stop and planned target — the levels you decided on before entering, not the ones you ended up at.
R-multiple — the result expressed in units of initial risk. A trade risking $300 that closes +$450 is +1.5R.
Realized P&L — the dollar result after the position is closed. Open positions are not journal entries yet.
Market context — session, broader trend, whether a known event window was active.
A one-line note — what you actually saw, in your own words, before you knew the outcome.
The fields most traders skip — context, planned stop, setup tag — are the ones that turn the journal from a P&L history into a feedback tool. Win rate per setup tells you which playbook to keep and which to cut; the aggregate alone hides it.
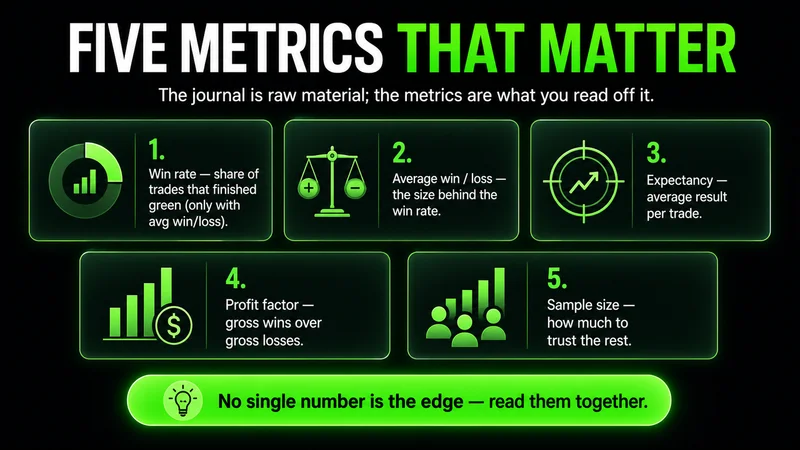
The metrics that turn a journal into feedback
The journal is the raw material. The metrics are what you read off it. Five do most of the work:
Win rate — the percentage of closed trades that finished green. Useful only when paired with average win and average loss. A 70% win rate with losses twice the size of wins is still a losing system.
Expectancy — the expected dollar or R result of an average trade, given your historical win rate and the relative size of wins versus losses. This is the number that tells you whether the edge is real.
Profit factor — gross profit divided by gross loss. Above 1 is net profitable. The working range for a sustainable discretionary edge sits between 1.3 and 2; higher numbers over small samples usually compress as the sample grows.
Maximum drawdown — the largest peak-to-trough decline in account equity. Historical max drawdown is the floor of what you should prepare for. The live one is usually bigger.
Realized P&L — the closed-position result, in dollars. The journal records this; unrealized P&L lives on the broker screen, not in the metrics.
Win rate alone is a vanity number. Expectancy and profit factor say whether the edge exists. Maximum drawdown says whether you can survive it while it works.
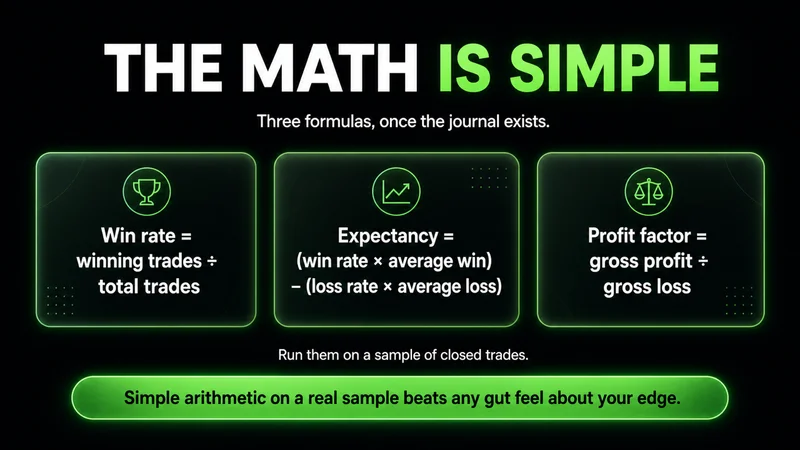
How to calculate win rate, expectancy, and profit factor from your journal
The math is straightforward once the journal exists. Take a sample of closed trades:
# | Setup | Entry | Exit | Size | Risk | P&L | R |
|---|---|---|---|---|---|---|---|
1 | NQ breakout | 17,820 | 17,860 | 1 | $300 | +$200 | +0.67R |
2 | NQ breakout | 17,900 | 17,884 | 1 | $300 | -$320 | -1.07R |
3 | ES pullback | 4,510 | 4,518 | 2 | $400 | +$800 | +2.0R |
4 | NQ breakout | 18,010 | 17,994 | 1 | $300 | -$320 | -1.07R |
5 | ES pullback | 4,495 | 4,488 | 2 | $400 | -$700 | -1.75R |
6 | GC range | 2,350.4 | 2,358.0 | 1 | $400 | +$760 | +1.9R |
From those six closed trades the math works out cleanly:
Win rate = winning trades ÷ total trades = 3 ÷ 6 = 50%.
Average win = ($200 + $800 + $760) ÷ 3 = $586.67.
Average loss = ($320 + $320 + $700) ÷ 3 = $446.67.
Expectancy = (win rate × average win) − (loss rate × average loss) = (0.5 × 586.67) − (0.5 × 446.67) = $70 per trade.
Profit factor = gross profit ÷ gross loss = $1,760 ÷ $1,340 = 1.31.
Maximum drawdown across this sequence = peak equity after trade 3 (+$680) to trough after trade 5 (−$340) = $1,020.
Six trades is too small for any of this to be stable. Expectancy and profit factor need fifty trades minimum before the noise calms, and maximum drawdown stays unreliable until the sample spans more than one market regime. The math is easy. Recording enough rows, honestly, is the hard part.
Realized vs unrealized P&L, and why the journal records only one
Realized P&L is the dollar result of a position after it is closed. Unrealized P&L is the floating mark-to-market of a position still open. Brokerage screens show both side by side. That is convenient for monitoring and useless for measuring.
Journals record realized. Until the position closes, there is no decision to grade — holding a +2R unrealized into close and ending +0.4R is a different trade than booking +2R on a partial and trailing the runner. Once the journal mixes the two, every metric distorts: expectancy inflates when open winners are counted, profit factor swings on positions still subject to invalidation. The practical rule: an entry is a journal row, an exit closes the row. Anything in between is monitoring, not data.
What to do when a metric flags a problem
Recording the metrics is half the work. The other half is a written rule for what each one is supposed to trigger. Without the rule, the number is information you ignore.
A working set of triggers:
Profit factor below 1.3 over the last fifty closed trades on a single setup — that setup gets paused or sized down by half until you isolate what changed. Either the regime moved out from under it, or execution on it has degraded. The context column is where you check which.
Current drawdown exceeds historical maximum drawdown by 50% — size goes to one-third for ten trades. Not zero. Going to zero usually becomes weeks of paper trading and a worse re-entry. One-third keeps the data flowing while damage stays small.
Win rate on a setup drops 15 percentage points below its rolling average over 30 trades — flag for review, not for cuts yet. Setups have noise. One stretch is not a signal; two stretches in a row, separated by a different market condition, is.
Average loss exceeds the planned risk by more than 20% — the most common quiet leak. Stops are being moved or trades held past invalidation. The fix is execution-side, not strategy-side.
Three consecutive sessions with realized P&L below −2R per session — the day ends. Fatigue distorts execution faster than most traders register, and the next trade is almost always worse than current frustration thinks it will be.
The specific thresholds will not be the same for every trader. The point is that some written threshold exists, decided before the drawdown, so the response is mechanical instead of emotional.
How to review trading performance without breaking your process
A review is supposed to feed forward, not relitigate. Most traders use the journal to argue with their past selves; that is a way to feel productive, not to improve.
A weekly review that actually helps:
Pull only closed trades from the week. Open positions distort judgment of the closed ones.
Group by setup tag, not by outcome. Looking at "all losers" teaches almost nothing. Looking at "all NQ breakout trades, sorted by R-multiple" surfaces patterns.
Compare execution to the plan, not the outcome. A trade that hit stop with a clean plan is operational. A trade that won despite breaking rules is a problem the equity curve has not punished yet.
Update one thing. Reviews that produce ten rule changes produce zero. One specific change, written down, tested over the next twenty trades.
Close the laptop. Reviewing for more than an hour past the data is rumination, not analysis.
Reviewing is also where the journal meets the chart — the kind of structural read on price action that explains why a setup that worked in March stopped working in May. The metrics tell you something changed; the chart tells you what.
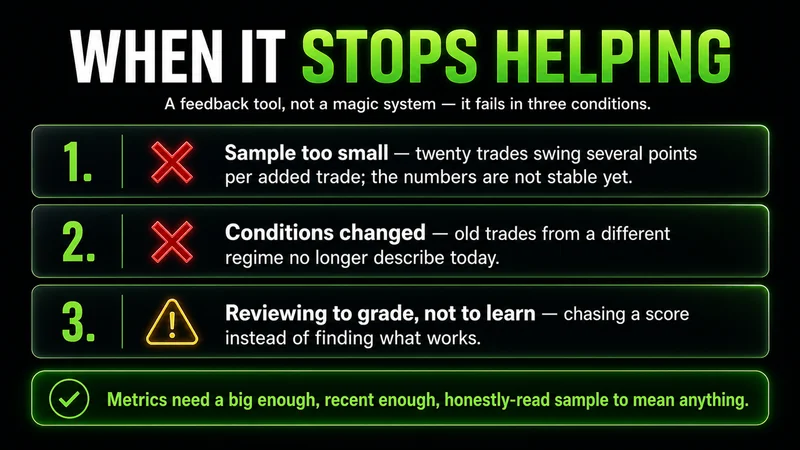
When the journal stops helping
The trading journal is a feedback tool, not a magic system. It loses its edge in three specific conditions.
The first is when the sample is too small. Twenty trades does not produce stable metrics — the numbers move three or four percentage points per added trade, and traders chasing those swings tune their system to recent noise. Below fifty trades on a single setup, the journal is for behavior tracking, not optimization.
The second is regime change. A clean range-day playbook that ran a 1.6 profit factor for six months can drop below 1 in a different volatility environment without the underlying logic being broken — the conditions just left. The journal will flag it, but late. Cross-checking against the broader market structure catches it earlier than the metrics alone do.
The third is when the data is dishonest. Self-recorded fields drift toward the version of the trade the trader wishes had happened. Risk gets rounded down, setup tags get reassigned in hindsight, "I exited because structure shifted" replaces "I panicked." Once the data is post-rationalized, the metrics are worse than nothing — they justify behavior that should be flagged. The fix is mechanical: record before the outcome is known, even if the note is one ugly sentence.
FAQs
What is a trading journal? A trading journal is a structured per-trade log of prices, size, setup, and context for every position you take, used to produce metrics like win rate, expectancy, and maximum drawdown. The point is to make decisions measurable.
How do you calculate win rate? Divide closed winning trades by total closed trades and multiply by 100. Open positions and exact break-even trades are usually excluded. Win rate alone is incomplete; pair it with average win versus average loss before drawing conclusions.
What is trading expectancy? Expectancy is the expected result of an average trade, in dollars or R, given your historical win rate and the relative size of wins versus losses. Formula: (win rate × average win) − (loss rate × average loss). Positive expectancy is the minimum requirement for an edge.
What is profit factor? Profit factor is gross profit divided by gross loss across a sample of closed trades. Above 1 is net profitable. The working range for a sustainable discretionary edge is 1.3 to 2 over fifty or more trades; very high numbers on small samples usually compress as the data grows.
What is the difference between realized and unrealized P&L? Realized P&L is the dollar result of a closed position. Unrealized P&L is the mark-to-market of a still-open position. The journal records realized; unrealized belongs on the broker screen because every metric distorts once open trades are counted.
Worth the read?