
Ascending Trendline — How to Draw, Confirm, and Trade
An ascending trendline connects higher lows on a chart to show where buyers defend progressively higher prices. Learn how to draw, confirm, and trade it with discipline.
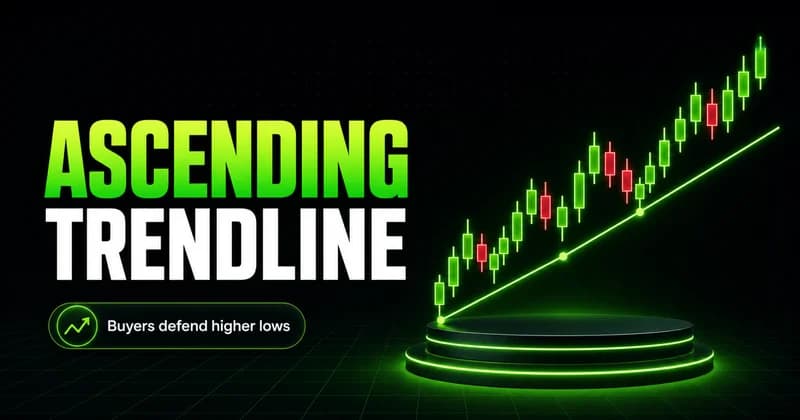
An ascending trendline is not a crystal ball. It is a visual record of buyers stepping in at progressively higher prices, and the real skill is reading the quality of each bounce rather than treating the line itself as a signal. Most traders draw the line and assume the trend will hold. The ones who survive learn to ask what each touch actually tells them about positioning and momentum.
Understanding how to draw, confirm, and trade an ascending trendline separates traders who follow structure from those who chase lines on a chart.
What an ascending trendline actually shows
An ascending trendline connects two or more swing lows on a price chart, drawing a straight line that slopes upward from left to right. Each point where price touches the line and bounces represents a moment where buyers defended a higher low. The line does not create support -- it visualizes the support that already exists in the order flow.
The slope matters. A steep slope suggests aggressive buying momentum that is difficult to sustain. A shallow slope reflects a more measured pace of higher lows, which typically holds longer. Neither slope guarantees continuation, but the angle tells you something about the urgency behind the move.
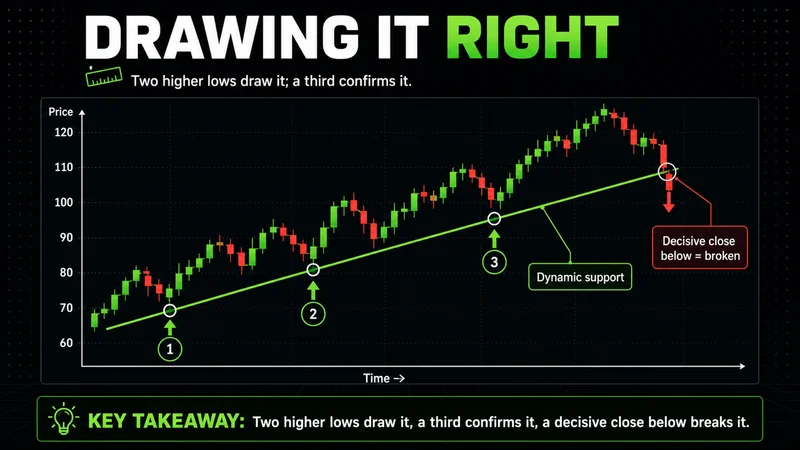
For an ascending trendline to be valid, you need at least two touchpoints. Three or more strengthen the line significantly because they demonstrate repeated behavior at the same structural level.
How to draw an ascending trendline on a chart
Drawing the line is simple in theory and imprecise in practice:
- Identify at least two significant swing lows where price bounced upward.
- Connect those lows with a straight line extending to the right.
- Confirm that no candle body cuts through the line between the touchpoints.
- If price pierces the line but closes above it, the trendline is still valid -- wicks through the line are common and do not constitute a break.
The biggest drawing mistake is forcing a trendline to fit a bias. If you have to ignore a swing low that clearly sits below your line, the line is wrong. The chart dictates the trendline, not the other way around.
Reading the quality of each bounce
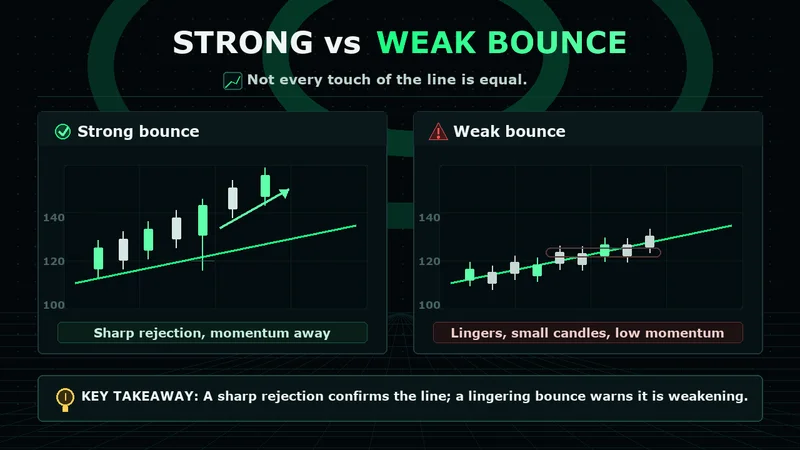
Not all trendline bounces are equal. A strong bounce shows a sharp rejection candle with momentum -- price touches the line and moves away quickly with conviction. A weak bounce lingers near the line, producing small candles and low momentum, which signals that buyers are present but not aggressive.
When bounces start losing momentum -- smaller candles, slower reactions, tighter ranges -- the trendline is losing structural significance even if price has not broken below it. This is where most traders get trapped: they see the line holding and assume the trend is intact while the internal quality has already deteriorated.
Volume confirms the read. A bounce with expanding volume suggests real buying interest. A bounce on declining volume suggests the line is being respected out of habit rather than conviction.
How to confirm an ascending trendline before entering a trade
Confirmation is the difference between a high-probability entry and a coin flip. Before entering near an ascending trendline, check for these conditions:
- A clear rejection candle at or near the trendline, not just a touch, but a candle that closes away from the line with momentum.
- Price holding above a prior swing low that aligns with the trendline.
- Broader market context that supports the direction. If the index is selling off aggressively, a trendline bounce on an individual name carries less weight.
- Volume expansion on the bounce, not contraction.
The entry itself should be risk-defined. Place a stop below the swing low that the trendline is connecting, not at the trendline itself. The trendline is a visual guide, not an exact price level -- stops need to account for the natural variance around the line.
Ascending trendline vs descending trendline
The difference between an ascending and descending trendline goes beyond slope direction. An ascending trendline connects higher lows and reflects a market where buyers are consistently defending higher prices. It is drawn below price action and acts as dynamic support. A descending trendline connects lower highs and reflects a market where sellers are capping rallies at progressively lower levels. It is drawn above price action and acts as dynamic resistance.
| Attribute | Ascending trendline | Descending trendline |
|---|---|---|
| Connects | Higher lows | Lower highs |
| Position | Below price | Above price |
| Acts as | Dynamic support | Dynamic resistance |
| Break signal | Potential bearish reversal | Potential bullish reversal |
| Typical context | Uptrend | Downtrend |
Neither line is inherently more reliable. What matters is how price behaves at the line and whether the broader structure supports the direction the line implies.
Common ascending trendline mistakes beginners make
Several recurring errors destroy the value of trendline analysis:
- Forcing the line to fit a narrative instead of letting the chart define it. If you have to ignore a swing low to make the trendline work, the line is fabricated.
- Treating a trendline break as an automatic reversal signal. A break below the line signals a change in the rate of higher lows, not necessarily a full trend reversal. Price can break a trendline and resume the uptrend after forming a new structure.
- Using a single timeframe. A trendline on a five-minute chart means almost nothing if the daily chart is in a downtrend. Context matters more than the line itself.
- Ignoring the slope. A nearly vertical trendline is unsustainable. Traders who buy bounces off a steep slope are buying into a move that will likely correct sharply.
- Placing stops directly on the trendline. Price regularly wicks through a trendline before bouncing. Stops need breathing room below the swing low, not the line.
Choosing the best timeframe for ascending trendline analysis
Timeframe selection depends on the trading style, but the principle is the same across all frames: the trendline needs enough data points to be meaningful. Day traders often use five-minute or fifteen-minute charts, where trendlines form and break quickly, requiring fast execution and tight risk management. Swing traders typically work with daily or four-hour charts, where trendlines carry more weight because they reflect a broader consensus of buyers defending higher lows over multiple sessions. Position traders and investors use weekly charts, where trendlines can persist for months or years and represent major structural levels.
The best practice is to draw trendlines on at least two timeframes. If a daily trendline aligns with a weekly trendline, the confluence strengthens the level significantly. If a five-minute trendline contradicts the daily structure, the shorter-frame line should be treated with caution.
When an ascending trendline stops working
No trendline holds forever. The question is not whether it will break, but how to read the signs that it is breaking down.
An ascending trendline loses its structural relevance when price breaks below it with conviction -- a strong candle that closes below the line, not just a wick through it. But the break alone is not the full picture. What happens after the break matters more.
If price breaks the trendline and immediately reclaims it in the next candle or two, the break was a sweep of liquidity sitting below the line. This is common in futures markets, especially during the opening hour when institutional algorithms hunt for resting orders. The trendline was technically broken, but the structure survived.
If price breaks the trendline and fails to reclaim it over several candles, the rate of higher lows has genuinely changed. This does not always mean a bearish trend is starting -- it often means the market is transitioning into a range or a slower uptrend with a shallower slope.
Most traders do not have a strategy problem. They have a discipline problem. Breaking rules during drawdown periods destroys more accounts than poor analysis.
Most breakouts fail because traders enter emotionally instead of structurally. The same applies to trendline breaks. A break without volume, without displacement, and without follow-through is more likely a liquidity grab than a genuine reversal.
FAQs
What is an ascending trendline in simple terms? It is a straight line drawn along higher lows on a price chart, connecting at least two swing low points. It shows the direction of an uptrend and acts as dynamic support where buyers have historically stepped in.
How many touchpoints does a valid ascending trendline need? A minimum of two touchpoints creates a valid trendline, but three or more significantly strengthen it. Each additional touchpoint demonstrates repeated buying behavior at the same structural level, which increases confidence in the line.
Can an ascending trendline be used for shorting? Yes, but not in the way most traders think. A break below a well-established ascending trendline can signal that the rate of higher lows is changing, which may present a short opportunity if confirmed by broader market structure. Shorting simply because price touches or slightly pierces the line is a low-quality entry.
What is the difference between a trendline break and a trendline breach? A break is a strong candle that closes below the trendline with momentum. A breach is a wick that pierces the line but closes back above it. Breaches are common and do not invalidate the trendline. Breaks require follow-through to confirm a structural change.
How does timeframe affect ascending trendline reliability? Longer timeframes produce more reliable trendlines because they reflect a broader consensus of market participants. A trendline on a daily chart carries more structural weight than one on a five-minute chart. The best practice is to check trendlines across at least two timeframes for confluence.
Key takeaways
An ascending trendline is a tool for reading market structure, not a prediction mechanism. The line visualizes where buyers have defended higher lows, but its value depends on the quality of the bounces and the broader market context. Drawing the line correctly, confirming entries with rejection candles and volume, and respecting the timeframe hierarchy are the habits that separate disciplined trendline trading from line-drawing exercises. When the trendline breaks, read what comes after the break -- a reclaim means the structure survived, while sustained acceptance below the line means the rate of higher lows has changed.
Worth the read?


