
Candlestick Patterns for Beginners — What They Actually Show
Candlestick patterns for beginners — what doji, hammer, engulfing, and three black crows actually show, and the conditions where each one stops working.
Candlestick patterns for beginners are best understood as a record of who lost control of the auction, not as predictive shapes. Each candle compresses an interval of order flow into four numbers — open, high, low, close — and the relationship between those numbers tells you whether buyers or sellers gave up first. The patterns matter only because they describe that handoff in a way the eye can read quickly. Treated as standalone signals, they fail constantly. Treated as a quick language for describing price behaviour inside a clear context, they become useful.
Most beginner material teaches the shapes and stops there. The shape is the easy part. The harder part is reading the candle relative to what came before it, where it sits in market structure, and whether the conditions that make the pattern reliable are actually present. This guide walks through the candles and patterns that show up most often in beginner education, with honest attention to where each one stops working.
What is a candlestick and what the body and wicks actually show
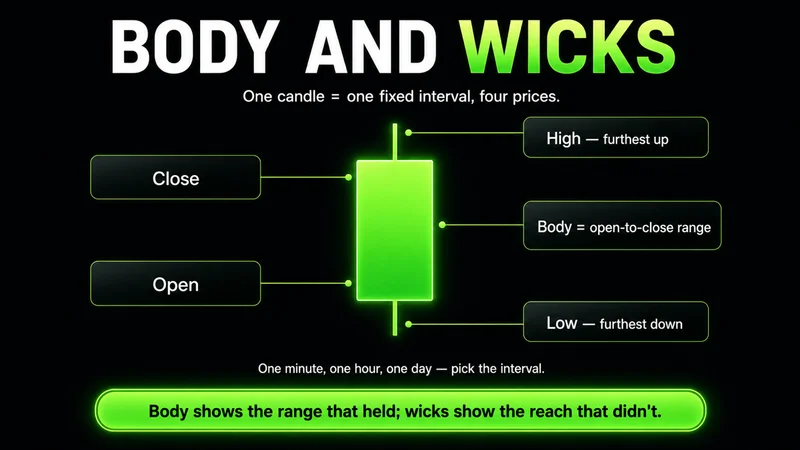
A single candlestick on a candlestick chart represents one fixed interval of trading — one minute, one hour, one day, one week, whatever the chart is set to. Four data points define it: where price opened, where it closed, the highest price traded inside that interval, and the lowest. The body is the distance between open and close. The wicks, sometimes called shadows, are the distance from the body out to the high and the low.
When the close is above the open, the body is conventionally drawn green or white — buyers ended the interval in control of price. When the close is below the open, the body is red or black — sellers ended in control. The colour by itself is a summary, not a verdict; a small green body after a vertical move up means something very different from a small green body after a long sideways base.
The wicks carry more information than most beginners realise. A long upper wick says price was pushed higher and then sold off before the interval closed — buyers tried, sellers answered, and sellers were holding the close. A long lower wick says the opposite — sellers pressed lower, buyers absorbed, and the close finished off the lows. The body tells you where the auction settled. The wicks tell you where the auction rejected. Reading those two together is the foundation of every pattern that follows.
How to read candlestick charts before learning patterns
The single most common beginner mistake is reading candles in isolation. A doji on its own is information about indecision inside that one interval. A doji at the third test of a clean support level, on a session where volume is concentrating, is something else entirely. Context is not optional — it is the thing that turns a candle from a static shape into a piece of evidence about the auction.
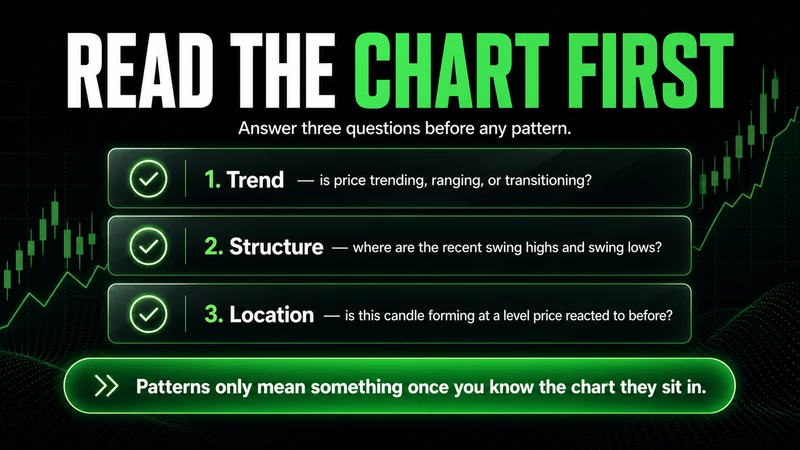
Before looking at any candlestick pattern, a beginner should be able to answer three questions about the chart in front of them:
Is price trending, ranging, or transitioning?
Where are the recent swing highs and swing lows?
Is the current candle forming at a level where the prior auction reacted, or is it forming in the middle of nothing?
If those answers are not clear, no pattern reading is going to be reliable, because there is no context to read the pattern against.
It also matters which timeframe the candle came from. The same shape on a one-minute chart and a daily chart are not comparable signals. Shorter intervals contain more noise — a one-minute hammer can form purely because a single resting order got hit. A daily hammer at a clean weekly level after a multi-day decline is a different category of information. Beginners are usually better served reading higher timeframes first and using lower timeframes only to refine execution within a context they already understand.
What are candlesticks and where the language came from
Candlesticks predate Western technical analysis by a long stretch. The format came out of Japanese rice trading and was popularised in the West by Steve Nison's work in the early 1990s. The history is worth knowing only because it explains the names — morning star, three black crows, hanging man, harami. The names are descriptive, sometimes poetic, and occasionally misleading. None of them improve the signal. What improves the signal is the same thing that improved it in the rice markets: pattern recognition built from thousands of hours of watching price.
There is no shortcut around screen time. Strategy matters, but observation builds the recognition that lets a pattern actually be useful in live conditions. The patterns below are the ones beginners encounter first and the ones whose failure modes are easiest to learn from.
The candlestick patterns beginners should learn first
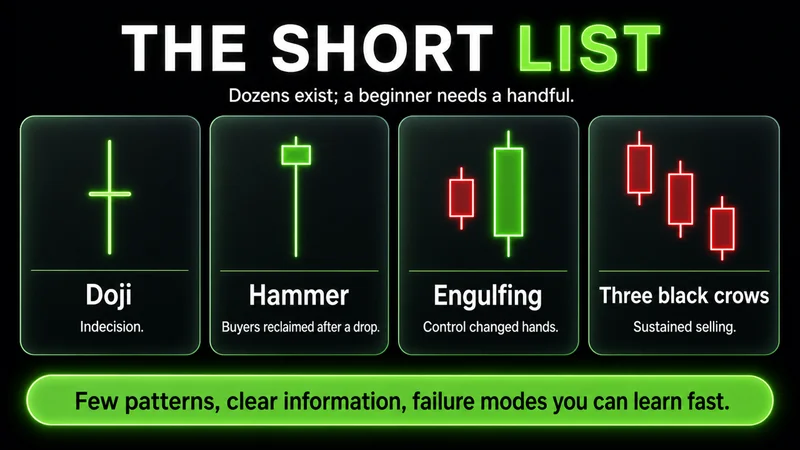
There are dozens of named candlestick patterns. A beginner does not need most of them. The short list below covers the ones that show up most often, carry the clearest information, and have failure modes you can learn from quickly.
Pattern | Candles | What it suggests |
|---|---|---|
Doji | 1 | Open and close almost equal; auction indecision |
Hammer | 1 | Long lower wick at a decline; sellers were absorbed |
Bullish engulfing | 2 | Up candle whose body fully covers the prior down body |
Bearish engulfing | 2 | Down candle whose body fully covers the prior up body |
Three black crows | 3 | Three consecutive long down candles; sustained selling |
Learn these five well before adding anything else. A trader who can read the context behind one pattern is more useful than one who can name twenty.
Doji, hammer, and what a single candle can and cannot tell you
A doji is a candle whose open and close are at or very near the same price. The body is essentially a horizontal line. The wicks can be long, short, balanced, or one-sided — each variation describes a slightly different kind of indecision. A doji says the interval ended without either side establishing control. That is genuinely useful information when it shows up at the edge of an established trend or at a level where price has reacted before. It is mostly noise in the middle of a range.
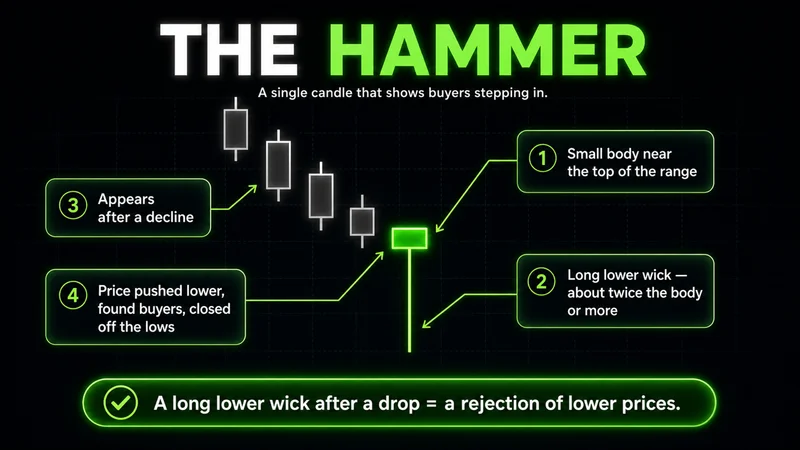
A hammer is a single candle with a small body at the top of the range and a long lower wick — at least twice the body length is the conventional guideline. The hammer appears after a decline and shows that price tried to push lower, found buyers, and closed off the lows. It is one of the few single-candle patterns that carries directional information on its own, but the information depends entirely on what came before. A hammer at the bottom of a multi-day move into a clean support level is one thing. A hammer in the middle of choppy sideways price is decoration.
The same one-candle shape carries different meaning depending on where it prints in the trend:
Hammer — small body up top, long lower wick, after a decline
Inverted hammer — small body at the bottom, long upper wick, after a decline
Hanging man — same shape as a hammer, but after an advance
Shooting star — same shape as an inverted hammer, but after an advance
The location in the trend changes the interpretation. The shape does not stand on its own.
Bullish engulfing and bearish engulfing patterns explained
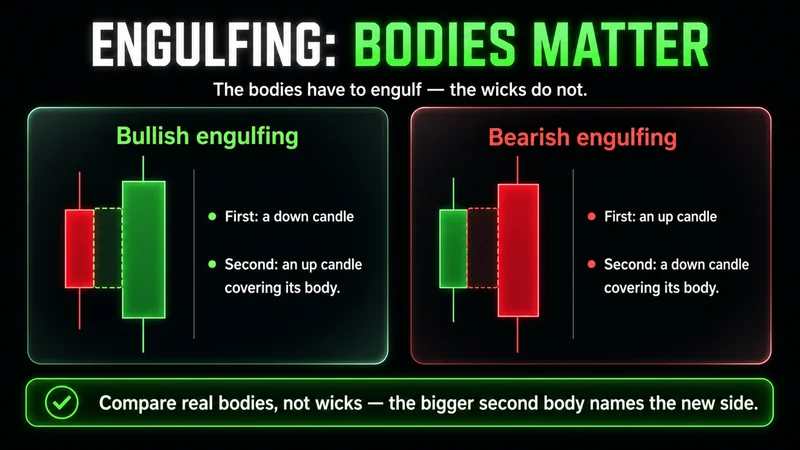
The bullish engulfing pattern is two candles. The first is a down candle. The second is an up candle whose real body fully covers the first candle's body. Wicks do not have to be engulfed — the bodies do. The pattern says the prior interval's selling was completely absorbed inside one interval and the closing auction handed control to buyers.
The engulfing patterns are useful because they describe a clean reversal of intent inside two candles. They are misleading when the engulfing candle's range is just the result of a gap on the open with no real participation behind it.
The bearish engulfing pattern is the mirror image. After an advance, a down candle's body fully covers a prior up candle's body, finishing below where buyers had taken price. The same logic applies — the second candle's range has to come from real participation, not from a thin overnight gap that no one defended. Bearish engulfing on a daily chart of a liquid index future, after a clear push higher into a known resistance level, is a different signal from a bearish engulfing on the second-most-illiquid hour of the overnight session.
A few conditions separate a usable engulfing read from a random one:
The engulfing candle prints near a known level — prior swing, prior session high or low, a clean range edge
Real participation builds across the engulfing candle, not just a gap on the open
The engulfing candle closes near its extreme, not back inside the prior body
The prior trend is mature enough that a reversal is plausible — not a single counter-candle inside a fresh leg
An engulfing pattern that meets these conditions is one of the cleanest beginner-readable patterns there is. One that meets none of them is essentially random.
Three black crows and what continuation patterns require
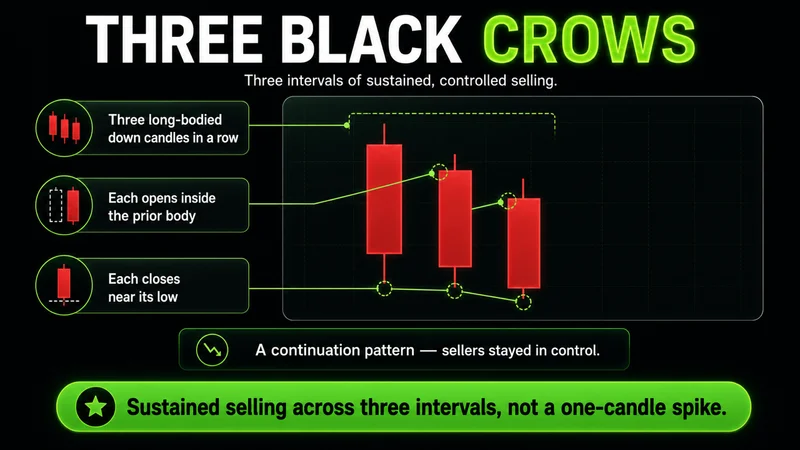
Three black crows is three consecutive long-bodied down candles, each opening inside the prior candle's body and closing near its lows. The pattern describes sustained, controlled selling — sellers were active across three intervals and each interval ended near the low of the range. After an advance, three black crows is often read as a reversal signal. Inside an existing downtrend, it can read as continuation.
Continuation patterns of this kind work best when the move they are signalling has room to run. Three black crows that prints into a major support level or into the lower bound of a developed range is much less useful than three black crows that prints with open space below. The pattern is describing momentum; momentum needs somewhere to go.
The equivalent bullish pattern, three white soldiers, is structurally identical with the colours reversed — three consecutive long up candles, each opening inside the prior body, each closing near the highs. The same context rules apply. Without room to run and without participation behind the candles, the pattern is just shape.
When candlestick patterns stop working
This is the section most beginner material skips. Patterns fail constantly, and the failure modes are predictable once you know where to look. Four conditions account for the majority of failures:
Thin liquidity outside cash hours
Expanded volatility regime around major events
Wrong-timeframe reading against higher-timeframe context
Pattern read in isolation, with no level or structure nearby
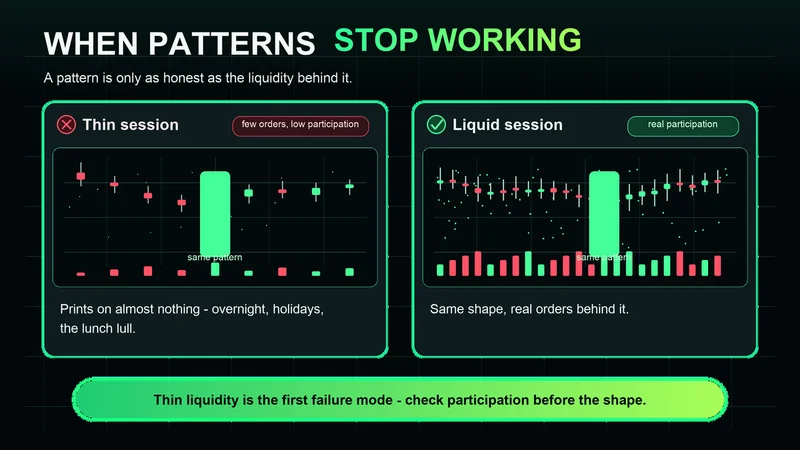
Thin liquidity is the first failure mode. A hammer, an engulfing, a doji — any of them can print purely because a small handful of orders went through during a low-participation window. Overnight on equity-index futures, on holiday sessions, during the lunch lull on US-stock single names — candles formed in these windows describe almost nothing about the wider auction. The same shapes during cash hours, on a liquid name, with volume behind the move, carry real information. The shape is identical; the meaning is not. A pattern formed in low-quality conditions is not a pattern you can trade.
Volatility regime is the second failure mode. Candlestick patterns implicitly assume the average range of recent candles is somewhere close to normal. When implied volatility expands sharply — around macro events, around earnings, around news shocks — the average true range can double or triple inside a few intervals. A doji during that environment is not indecision; it is just a candle that happens to print near its open while the next ten candles move ten times further than usual. The framework that gives the pattern meaning has temporarily inverted. Wait for ranges to normalise before reading shapes again.
Wrong timeframe is the third. A reversal pattern on a one-minute chart that is going against a clean trend on the hourly chart is rarely a reversal — it is a pullback inside a larger move. Beginners often pick the smallest timeframe they can read because patterns print more often there. Patterns also fail more often there. The higher timeframe sets the context; the lower timeframe shows the noise.
Isolation is the fourth and the most common. A pattern with no surrounding context — no level, no structure, no participation — is a coin flip with a name attached. The names make the coin flips feel like signals. They are not.
Common candlestick mistakes beginners make
The patterns above are not the problem. How they get used is. The mistakes below show up across every beginner trader, regardless of which market they came from.
Trading the shape, not the location. A hammer in the middle of a range is decoration. A hammer at the third tag of a clean weekly level is a piece of evidence. Beginners learn the shapes first and the levels later. Reverse that order.
Treating every candle as a setup. Most candles say almost nothing. Forcing readings on every interval guarantees noise becomes signal. Trade fewer intervals, more carefully.
Ignoring the candle relative to its neighbours. A pattern is about the relationship between candles, not the candle alone. A bullish engulfing that engulfs a doji is not the same as one that engulfs a long red body.
Reading patterns on illiquid hours. Overnight, lunch lull, holiday sessions — the candles print, but participation is thin, and the patterns mean less.
Skipping invalidation. Every reading should come with a price that would prove it wrong. If a hammer's low gets taken out cleanly, the hammer was incorrect about the auction. Define that level before the read becomes a position.
Confusing more patterns with more skill. Knowing twenty patterns is not better than reading five carefully. The market does not reward vocabulary.
Using patterns without timeframe alignment. A reversal read on the one-minute chart against a clean trend on the hourly chart is usually a pullback, not a reversal.
Most of these collapse into one root cause. Beginners use candlestick patterns as a substitute for thinking about context. The patterns are a language for describing what already happened. They are not a prediction engine.
What to record so the patterns start teaching you
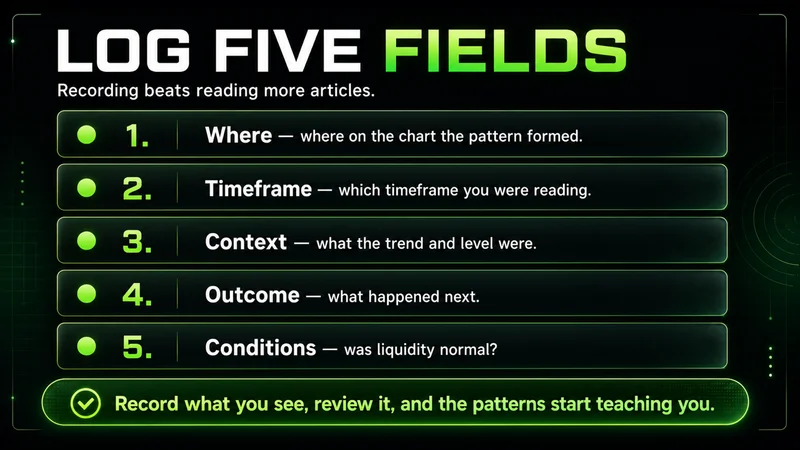
The fastest way to develop pattern recognition is not reading more articles. It is recording what you see and reviewing it. For every pattern you act on, log five fields:
Where the pattern formed on the chart
What timeframe you were reading
What the prior candles looked like
What level, if any, was nearby
What price would have invalidated the read
Then review the log a week later, a month later, three months later, against what price actually did next. Patterns become useful when the recognition is yours — pulled from your own observed outcomes — not when the shape memorisation is borrowed.
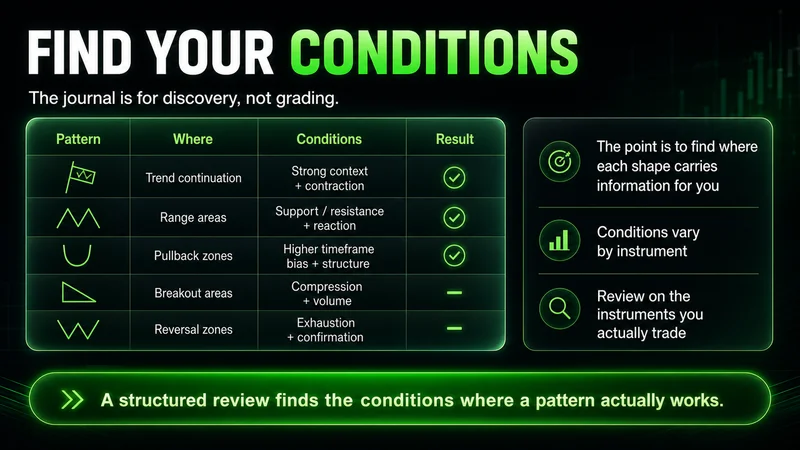
A structured trading journal and performance review makes this faster. The point of recording the patterns is not to grade yourself; it is to find the conditions under which each shape actually carries information for you, on the instruments you actually trade. Those conditions vary by instrument — a hammer on an index future is not the same animal as a hammer on a small-cap single name. The journal is what surfaces those differences.
FAQs
What are candlesticks in trading? Candlesticks are a chart format that shows the open, high, low, and close of price over a fixed interval. The body marks the open-to-close range; the wicks mark the full high-to-low range. Together they describe how the auction moved and where it settled.
How do you read candlestick charts as a beginner? Read the trend, the recent swing highs and lows, and the level price is currently near, before reading any individual candle. Then read each candle as a relationship between body and wicks, and as a relationship to the candle that came before it. The pattern is in the sequence, not the single shape.
What is a doji candlestick? A doji is a candle whose open and close are at or very near the same price, leaving an almost flat body with wicks above, below, or both. It describes one interval of indecision in the auction. It carries more meaning at the edge of a trend or at a tested level than in the middle of a range.
What is a hammer candlestick? A hammer is a single candle with a small body near the top of its range and a long lower wick, appearing after a decline. It says sellers pushed price lower, were absorbed by buyers, and the interval closed near the highs. The location in the trend matters more than the shape.
What is a bullish engulfing pattern? A bullish engulfing is a two-candle pattern where an up candle's real body fully covers the prior down candle's body. After a decline, near a known level, with real participation behind the engulfing candle, it describes a clean handoff from sellers to buyers across two intervals.
What is a bearish engulfing pattern? A bearish engulfing is the mirror of the bullish version. After an advance, a down candle's body fully covers the prior up candle's body, leaving the close below where buyers had taken price. Real participation in the engulfing candle is what separates the signal from a gap-driven shape.
What is the three black crows pattern? Three black crows is three consecutive long-bodied down candles, each opening inside the prior candle's body and closing near its lows. It describes sustained, controlled selling across three intervals. As a reversal signal after an advance it works best with open space below the pattern.
Are candlestick patterns reliable for beginners? The patterns themselves are reliable as descriptions of past behaviour. They are unreliable as standalone predictions. Used inside a clear context — trend, level, participation, timeframe alignment — they become useful. Used in isolation, they are essentially random.
Which candlestick patterns should beginners learn first? Doji, hammer, bullish engulfing, bearish engulfing, and three black crows. These five cover the major one-, two-, and three-candle structures and have failure modes that are easy to study. Add more patterns only after these five read cleanly in live conditions.
Reading patterns is reading the auction
The shortest version of everything above is that candlestick patterns are a vocabulary for describing what the auction did. The vocabulary is small and worth learning. It is not a substitute for reading context, defining invalidation, and recording what you observe. A trader who can read five patterns inside the right conditions has more usable skill than one who can name fifty without context.
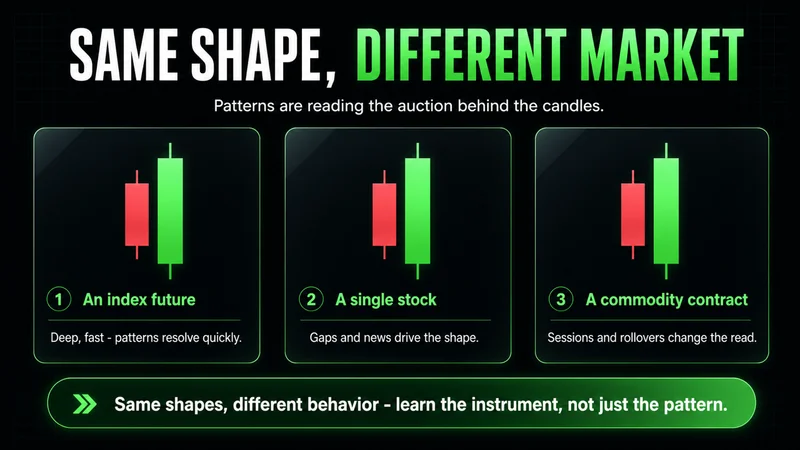
If this is the first time the language is clicking, the next step is to learn what each market actually trades like behind the candles. Patterns on an index future, on a US single-stock, on a futures contract on gold — same shapes, different behaviour. Reading the instruments themselves gives the candles something concrete to describe. Pattern recognition compounds from there.
Worth the read?


