
Stock Market History — What Traders Should Know
Stock market history is less a list of dates than a study of how crowds price risk, and that behavior barely changes from one crash to the next.
Stock market history is the record of how public share trading developed from informal merchant deals into the regulated, electronic exchanges that price companies today. It runs from 17th-century Amsterdam through the Buttonwood Agreement of 1792 to the screen-based markets of the present. Read carefully, that record is less a list of dates than a study of how people behave around risk, and that part has barely changed.
Most people treat stock market history as trivia. The founding year of the New York Stock Exchange, the size of a famous crash, the name of the first listed company. Useful for a quiz, easy to forget. The traders who get value from it read it differently. They look at the same crashes, manias, and recoveries and ask one question. What was the crowd doing right before the move, and does that pattern still show up on the chart in front of you today? It usually does.
This article walks the timeline, but it keeps returning to that practitioner question. The dates are the structure. The behavior underneath them is the point.
What stock market history actually means
Stock market history is the documented evolution of organized equity trading: the venues, the rules, the instruments, and the recurring episodes of expansion and collapse that shaped them. The meaning sits in two layers. The surface layer is institutional, covering how exchanges formed, how settlement worked, and how regulation arrived after each failure. The deeper layer is behavioral, covering how participants priced fear and greed across centuries with remarkably consistent results.
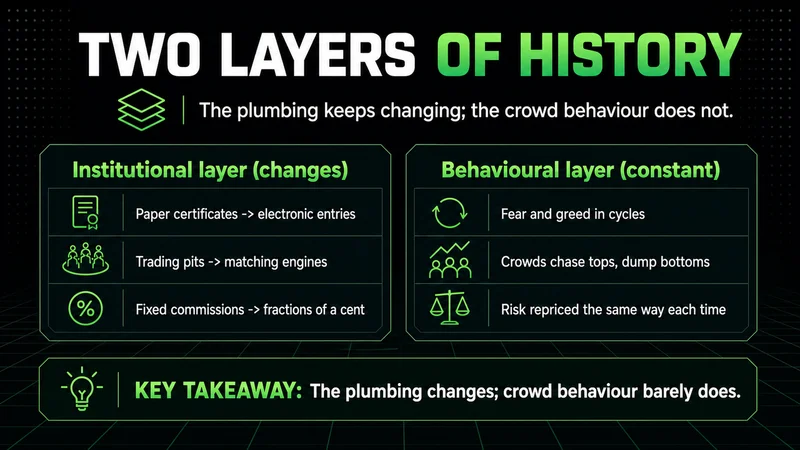
The institutional layer changes constantly. Paper certificates became electronic book entries. Open-outcry pits became matching engines. Commissions that were fixed by agreement became fractions of a cent. If you only study the institutional layer, stock market history reads as steady technological progress, and progress is a poor teacher because it implies the past is obsolete.
The behavioral layer barely moves. Crowds chase price after it has already run. Liquidity disappears at the exact moment everyone wants it. Confident narratives form at tops and despair forms at bottoms. That layer is why an experienced trader can read an account of the 1929 break or the 1987 crash and recognize the order flow without needing a single modern chart. The mechanism is new. The participants are not.
So when someone asks what stock market history means, the honest answer has two parts. It means knowing how the machinery was built. It also means knowing that the machinery never fixed the human inputs, which is exactly why the same risks keep returning in new clothing.
When the stock market began, and who started it
The first recognizable stock market began in Amsterdam in the early 1600s. The Dutch East India Company issued shares to the public to fund expensive, risky trading voyages, and those shares traded on a formal exchange where prices moved on news, rumor, and speculation. That is the moment a tradable claim on a business became a liquid, repriced-by-the-crowd instrument rather than a private contract.
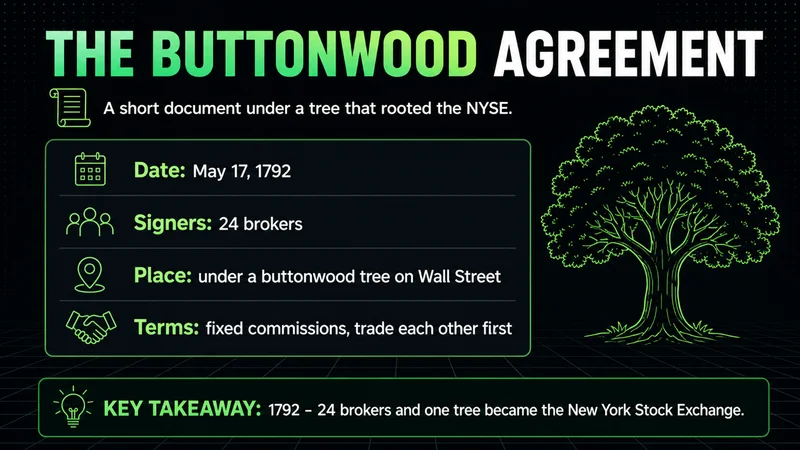
The American story starts later and more modestly. On May 17, 1792, 24 brokers signed the Buttonwood Agreement under a tree on Wall Street. The document was short. It set fixed commissions and committed the signers to trade with one another first. That agreement is the root of the New York Stock Exchange, though the formal organization with a written constitution did not arrive until 1817, under the name the New York Stock and Exchange Board.
No single person started the stock market in the way a founder starts a company. It emerged because two needs met. Businesses needed capital they could not raise alone, and savers wanted a share of the returns without running the enterprise themselves. The exchange was the meeting point. Understanding that origin matters for a trader because it frames what an exchange actually is: a liquidity venue built to match buyers and sellers, not a scoreboard built to reward conviction.
It is worth sitting with how quickly speculation followed the structure. The Amsterdam market did not stay a calm clearinghouse for voyage financing. Within a few decades, traders were dealing in forward contracts, short positions, and rumor-driven price swings, and a Dutch trader named Joseph de la Vega described the resulting psychology in 1688 with language that would read naturally on a modern desk. The instruments were centuries old. The behavior, the fear of missing a move and the panic of holding the wrong side, was already fully formed. That is the first and most durable lesson buried in the origin story: the moment ownership became liquid, it also became emotional, and no reform since has separated the two.
The American origin carries the same texture. The Buttonwood signers were not building a noble institution. They were a small group protecting their own commissions and order flow by agreeing to deal with one another first. The exchange that grew from that agreement inherited both the usefulness of centralized liquidity and the conflicts of a closed club, and much of the regulation that arrived later existed to manage exactly that tension. Reading the origin honestly keeps you from romanticizing the market into something it has never been.
How the stock market evolved through the centuries
The clearest way to read stock market history is as a sequence of capability jumps, each one widening access and speed while leaving the core behavior untouched. The table below compresses the long arc into the shifts that actually changed how price gets made.
| Period | Defining shift | What it changed for participants |
|---|---|---|
| 1600s, Amsterdam | First public share trading | Ownership became liquid and repriced daily |
| 1790s to 1810s, New York | Buttonwood Agreement, formal board | Centralized rules and fixed commissions |
| Late 1800s | Dow Jones Industrial Average, ticker tape | A shared benchmark and faster price distribution |
| 1930s | Securities regulation after the 1929 crash | Disclosure rules and oversight of abuse |
| 1971 onward | NASDAQ electronic quotation | Trading without a physical floor |
| 2000s onward | Decimalization, algorithmic execution | Tighter spreads, machine-speed order flow |
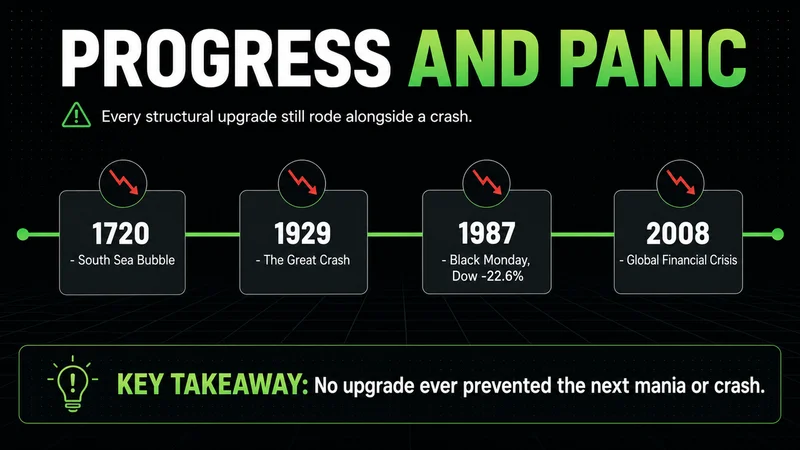
Each row is a genuine improvement in market structure. Yet sitting alongside that progress is a second sequence that no upgrade prevented: the manias and crashes. The South Sea episode in the 1700s, the speculative buildup into 1929, Black Monday in 1987 when the Dow fell about 22.6 percent in a single session, the dot-com collapse, the 2008 credit crisis. Different decades, different instruments, the same shape. Price extends far past what cash flows justify, positioning becomes one-sided, then liquidity withdraws and the move reverses faster than anyone sized for.
That pairing is the real lesson of the centuries. The market got faster, cheaper, and more transparent. It did not get calmer. If anything, the speed of modern execution compresses the same emotional cycle into a shorter window, which is why a flash break today can do in minutes what took weeks in an earlier era.
Walk the crashes in sequence and the repetition becomes hard to ignore. The South Sea episode of 1720 took a single company's shares from a modest price to a speculative peak and back to ruin within a year, wiping out investors who had borrowed to chase the move. The buildup into 1929 ran on margin debt and a widely shared belief that prices had reached a permanently high plateau, a phrase that has aged into a warning. The break that followed did not bottom for nearly three years, and the recovery to the prior high took far longer than most accounts remember. Black Monday in 1987 compressed the panic into one session, with the Dow losing about 22.6 percent in a day, driven in part by mechanical selling programs that fed on themselves. The dot-com collapse around 2000 punished a narrative that revenue and cash flow no longer mattered. The 2008 credit crisis showed that leverage hidden inside the financial system could turn a housing problem into a global liquidity freeze.
Five episodes, three centuries, one structure. Price extends well beyond what fundamentals support, participants crowd onto a single side using borrowed money, a confident story justifies the extension, and then the marginal buyer disappears. The reversal is not gentle, because the same leverage and one-sided positioning that fueled the rise now force liquidation in the opposite direction. A trader who internalizes that sequence does not need to predict the next crash. They need to recognize the conditions, because the conditions are what repeat.
From the trading floor to the screen: the modern stock market
The most visible difference between stock market history and the modern stock market is the disappearance of the physical floor. For most of the timeline, trading meant people standing in a pit, shouting orders, and matching them by hand. NASDAQ broke that model in 1971 by quoting and matching electronically over a computer network, and within a few decades nearly all volume moved to screens.
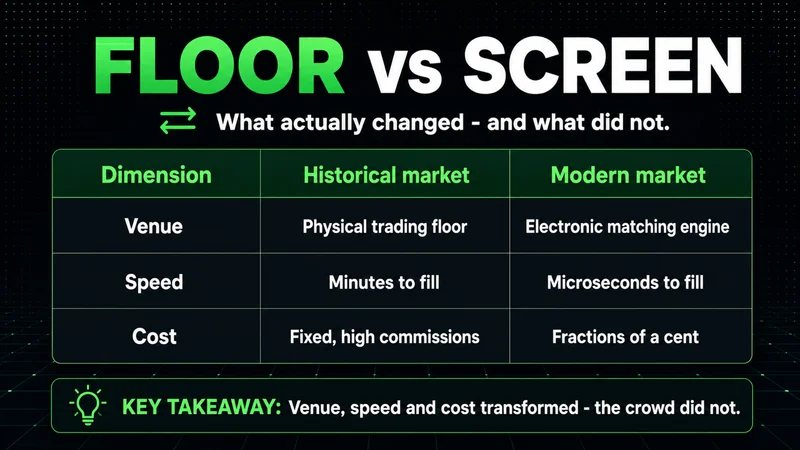
Comparing the two states directly is the fastest way to see what actually changed and what did not.
| Dimension | Historical market | Modern stock market |
|---|---|---|
| Venue | Physical trading floor | Electronic matching engine |
| Speed | Minutes to fill | Microseconds to fill |
| Cost | Fixed, high commissions | Fractions of a cent per share |
| Access | Brokers and the wealthy | Almost anyone with a phone |
| Dominant participant | Human floor traders | Algorithms and institutions |
| Information flow | Ticker tape, delayed | Real-time global data |
What this comparison hides is the constant. In both columns, price is still set by the balance of willing buyers and sellers, and that balance still swings on emotion under pressure. A retail trader today has tools an institution could not have imagined in 1950. That same trader still buys the high because it feels safe and sells the low because it feels urgent. The interface modernized. The decision-making did not.
There is also a cost to the democratized access. When almost anyone can buy in a single tap, the crowd at the extremes gets larger and faster. Cheap, instant access did not remove the historical pattern of late buyers arriving at tops. It scaled it.
The shift to electronic markets also changed who you are trading against, and that is worth understanding before you assume modern tools tilt the field your way. On the old floor, your counterparty was a human with the same delays and limits you had. On a modern matching engine, much of the resting liquidity and a large share of the volume comes from algorithms that read order flow faster than any person can. This does not mean the market is rigged against you in some conspiratorial sense. It means the speed advantage you feel relative to a 1950s trader is shared by participants who are far faster still, so the edge does not come from your tools. It comes from process, patience, and risk control, the same places it has always come from. History is consistent on this point: every technological upgrade that traders believed would hand them an advantage was quickly absorbed into the cost of doing business, and the durable edge stayed behavioral.
What stock market history teaches investors about risk
For investors, the most valuable thing in stock market history is not the recoveries. It is the drawdowns. Markets recovered from every major crash eventually, and that fact gets quoted constantly. The part that gets skipped is how long some recoveries took and how much capital and conviction got destroyed along the way. An average can hide a decade.
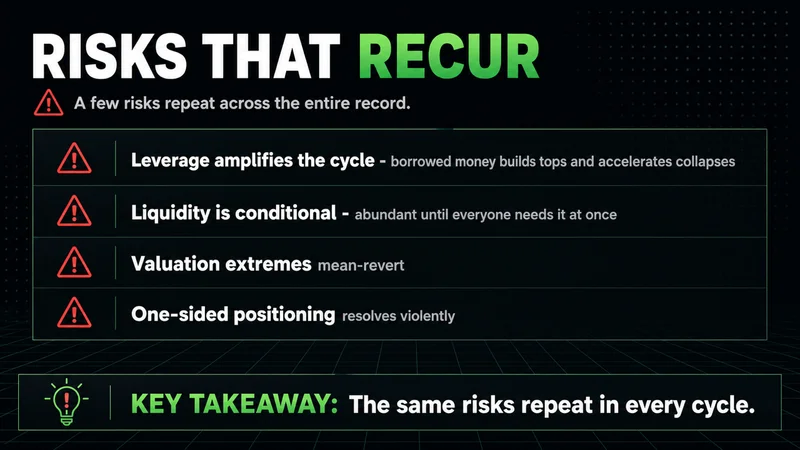
A few risks recur across the entire record, and they are worth stating plainly:
- Leverage amplifies the cycle. Borrowed money built the speculative tops and accelerated the collapses. The 1929 episode was a margin story as much as a valuation story.
- Liquidity is conditional. It looks abundant until the moment everyone needs to exit, then it thins out exactly when it matters most. Every crash in the record shows this.
- Narratives peak at the wrong time. The most confident, widely shared story about why a market cannot fall tends to arrive near the top, not the bottom.
- Survivorship hides the losers. The index that recovered is the one still quoted. Individual companies that anchored a mania often never came back.
Here is the experience-based view that separates a chart from a strategy. Most account damage in any era did not come from a single bad forecast. It came from oversized positions held through a drawdown the trader was not financially or emotionally built to survive. Stock market history is full of people who were directionally right and still ruined, because they confused conviction with capacity. Protecting capital across the difficult stretches is what lets the eventual recovery matter to you at all.
Consider what a recovery actually demands of the person holding through it. The often-quoted fact that the market always came back assumes you stayed solvent and unleveraged long enough to be there when it did. The investor who bought near the 1929 peak on margin did not get to enjoy the eventual recovery, because the margin call removed them from the market years before it arrived. The same logic applies to a trader carrying a position three sizes too large into a 2008-style liquidity freeze. The math of recovery is indifferent to your account; it describes the index, not your ability to hold it. This is why capital preservation is not a conservative preference. It is the precondition for every other outcome you might want. A position sized so that one ordinary drawdown threatens your survival has already failed, regardless of whether the broader thesis eventually proves correct.
This is also where one belief worth stating directly comes from. The market rewards patience far more than activity. The historical record is not a list of traders who found the perfect entry; it is a list of survivors who avoided the fatal mistake long enough for their process to compound. Most people studying history look for the setup that would have caught the bottom. The more useful study is the discipline that would have kept you in the game until any reasonable setup could work.
How stock market history affects the way traders execute today
For an active trader, stock market history is not a museum. It is a probability map. The recurring structure of manias and breaks shows up at every timescale, from a multi-year cycle down to a single session. Recognizing the pattern does not let you predict the turn. It lets you prepare for it, size for it, and react without hesitation when the structure confirms.

The practical influence shows up in three places. It shapes how you read extended moves, because history teaches that one-sided positioning and parabolic price tend to resolve violently. It shapes how you treat liquidity, because every historical crash proves that exits get expensive precisely when you most want one. And it shapes patience, because the record rewards traders who wait for confirmation over those who anticipate the turn and get run over before structure agrees with them.
Take liquidity specifically, because it is the lesson traders learn last and pay for most. On paper, a liquid market means you can always get out near the last price. History says otherwise. In every serious break, from 1929 to 1987 to 2008, the bid stepped away exactly when the crowd needed it, and the gap between where you wanted to sell and where you could actually sell widened violently. The instruction this leaves is concrete. Size your position for the exit you will get during stress, not the exit you see on a calm screen. A trader who assumes the calm-day spread will hold during a panic has not read the history, because the history is unanimous that it will not.
The same record reframes how you treat conviction. The most dangerous moments in stock market history were not the ones that felt risky. They were the ones that felt safe, where the prevailing story explained why the old rules no longer applied. A new economy, a permanently high plateau, a financial innovation that had supposedly engineered risk away. Each time, the comfort was the signal. This does not mean you fade every confident market; that is its own way to get run over. It means you hold your own conviction loosely, keep a defined level where you are wrong, and stay suspicious of any thesis that requires history to stop mattering.
The market does not repeat the same prices. It repeats the same behavior around them, and that is the only edge history actually hands you.
This is also where the lesson breaks down if you apply it carelessly, so it has to be qualified. Pattern recognition from history works while the market is trading on participant behavior and structure. It fails fast during forced, mechanical events — a sudden liquidation cascade, an exchange halt, or a macro shock that reprices everything at once. In those windows, the historical analog inverts. Levels that held cleanly all session mean almost nothing, correlations that guided your sizing snap, and the orderly behavior the pattern relies on simply is not present. A trader who treats a historical setup as valid during one of those mechanical breaks is reading a map of a city that is currently on fire. The discipline is knowing the difference between a behavioral market, where history informs you, and a mechanical one, where it actively misleads you.
Common mistakes beginners make when reading stock market history
Beginners tend to extract the wrong lessons from the same record an experienced trader finds useful. The errors are predictable, which makes them avoidable.
- Treating recovery as a guarantee. Markets recovered in aggregate; specific stocks and timelines did not. Survivorship bias turns a survivable strategy into reckless conviction.
- Confusing the era with the behavior. Beginners dismiss old crashes as irrelevant because the instruments were primitive. The instruments were primitive. The crowd was not, and the crowd is what repeats.
- Reading only the tops. The exciting part of history is the mania. The instructive part is the slow, grinding drawdown that followed, which is the part beginners skip.
- Mistaking a date for a cause. Memorizing that 1987 happened teaches nothing. Understanding why one-sided positioning and thin liquidity made it possible teaches a lot.
- Assuming modern tools removed the risk. Faster, cheaper access changed the speed of the cycle, not its existence. New tools, same trap.
The thread connecting these mistakes is impatience with the boring middle. History is most useful in its least dramatic passages, the long recoveries and the quiet buildups, and that is exactly where attention fades.
A stock market history checklist for beginners
If you want stock market history to improve your decisions rather than fill your memory, work through it deliberately. This checklist turns the record into something usable at the desk:
- Read each crash for behavior, not the body count. Ask what positioning and what story preceded the break, then look for the same setup live.
- Track how long recoveries took, not just that they happened. The duration tells you how much capital you would have needed to survive intact.
- Separate the institutional change from the behavioral constant. Note what the upgrade improved, then note what it left untouched in participant behavior.
- Map a historical mania onto a current chart. Compare the shape of an old top with anything extended you are watching now, as a structural reference, not a signal.
- Define your invalidation before you act on any pattern. History gives context, not certainty, so every idea drawn from it still needs a level where you are simply wrong.
- Decide in advance what a mechanical break looks like for you. Name the conditions — a halt, a cascade, or a macro shock — under which you stop trusting historical analogs entirely.
The point of the checklist is conversion. Stock market history only earns its place in your process when each episode leaves you with a clearer rule about risk, sizing, or patience, rather than another fact to recite.
FAQs
What is stock market history in simple terms? It is the record of how public share trading grew from early exchanges like Amsterdam in the 1600s into today's electronic markets, including the major manias and crashes along the way. The useful part is the recurring human behavior around risk, which has stayed consistent even as the technology changed completely.
When did the stock market start? Organized public share trading began in Amsterdam in the early 1600s with the Dutch East India Company. In the United States, the New York Stock Exchange traces its origin to the Buttonwood Agreement of 1792, with a formal organization following in 1817.
How is stock market history different from the modern stock market? The modern stock market is electronic, near-instant, low-cost, and open to almost anyone, while historical trading happened on physical floors with high commissions and limited access. What carried over unchanged is that price is still set by the balance of buyers and sellers, and that balance still swings on emotion under pressure.
Why does stock market history matter for investors and traders? It maps how risk actually behaves, especially how leverage, thin liquidity, and confident narratives cluster near tops before sharp reversals. That map helps you size positions, respect drawdowns, and recognize an extended move, even though it never predicts the exact turn.
What is the most common mistake beginners make with stock market history? Treating recovery as guaranteed and ignoring how long and painful some recoveries were. Aggregate indexes recovered, but specific stocks and timelines did not, and survivorship bias turns that gap into overconfidence.
Where to take your stock market history next
Stock market history is most valuable when you stop reading it as a timeline and start reading it as a behavior study. The dates anchor the structure, but the recurring patterns of risk, liquidity, and crowd positioning are what carry forward to the chart in front of you.
From here, the productive next steps are practical. Study market structure and liquidity behavior in live conditions, since that is where the historical patterns actually appear. Work through how leverage and position sizing shaped the major drawdowns, because that is where most accounts were lost. And revisit one historical crash in depth, reading it purely for the order flow and the crowd behavior, until you can recognize the same sequence forming in real time. That is the point where history stops being trivia and starts protecting capital.
Worth the read?


